TrueData™ SURVEYS
Net Promoter Surveys for B2B. More Than a Score.
We design Net Promoter Surveys for B2B companies and analyze the feedback. You’ll learn what’s driving your score, where to focus, and how to grow your company.


B2B Survey Experts + Third-Party Objectivity + Software Included
We bring certified CX analysts (CCXP) and proven methods. You’ll have an engaging survey with data you can trust.
See What Drives Your 9’s and 2’s.
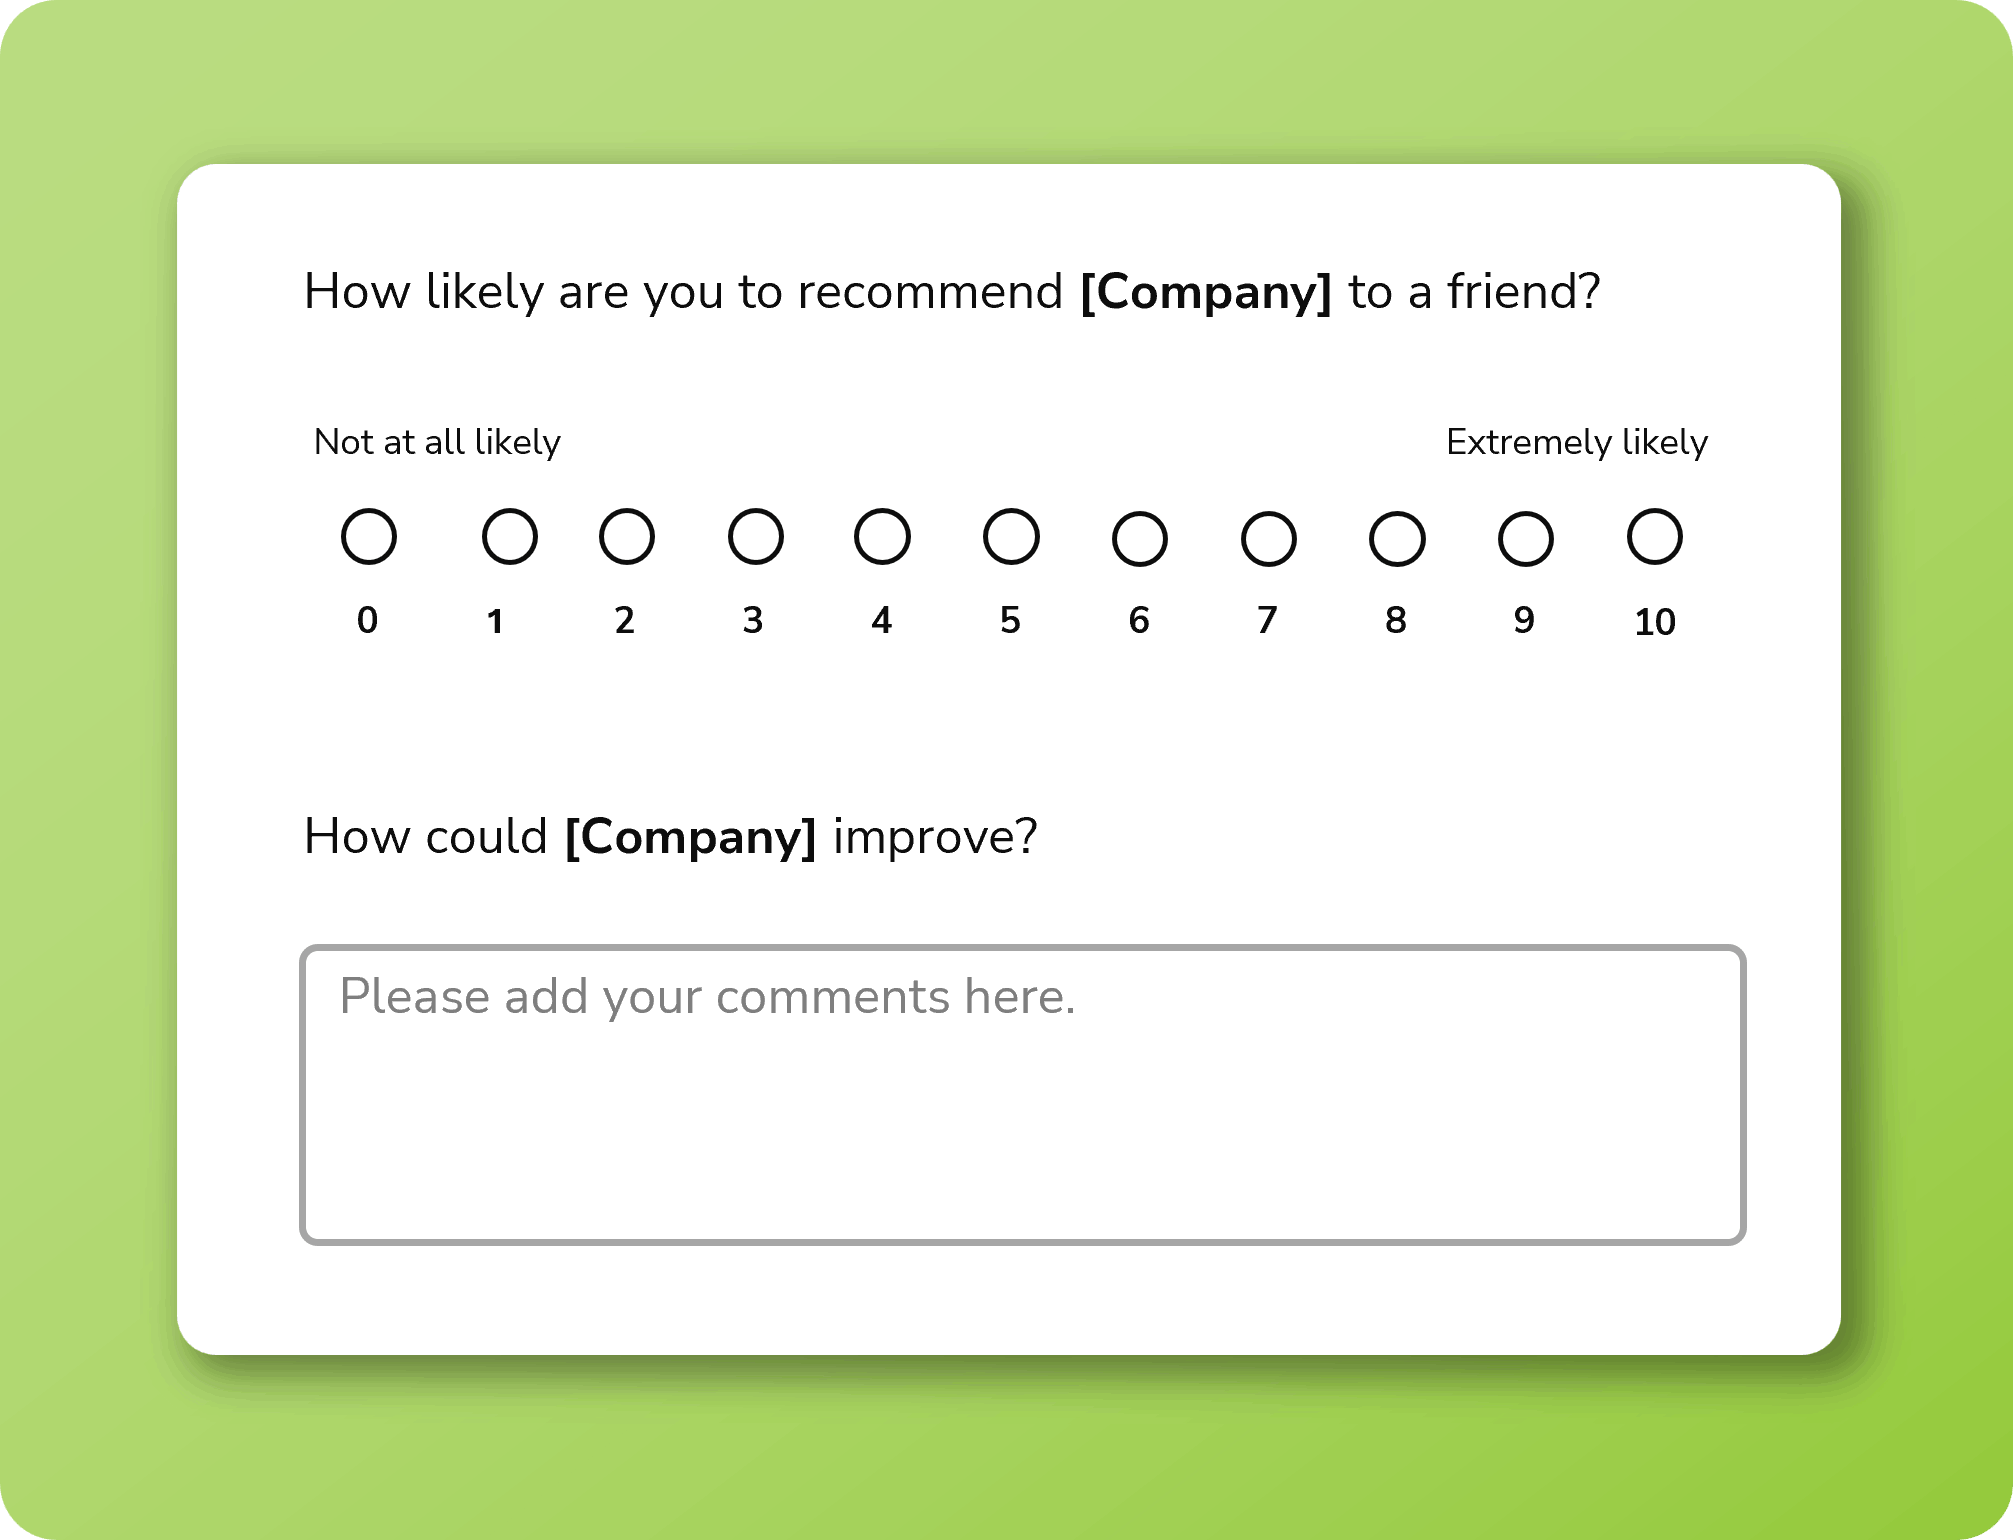
A Net Promoter Survey asks one question: how likely are you to recommend our company to a colleague?
B2B companies use NPS to track and benchmark customer loyalty. But the score alone can’t tell you why your customers rated you a 4, or why your profitable customers dropped from 9 to 6 last quarter.
That’s why we go past the score itself. We segment your results by account size, job title, market vertical, and more, showing you where loyalty is climbing or falling across your book of business.
The result? Actionable feedback to steer your B2B company and drive growth.
Talk to a Survey Expert
The world doesn’t need more customer surveys.
It needs better ones.
Relevant questions ➔ Reliable data ➔ Clear direction.
Curious or have a customer survey challenge? Share a few details. A CCXP-certified survey expert will follow up.


"*" indicates required fields

With Us, You’ll Have a Complete B2B NPS Program
Interaction Metrics runs your B2B Net Promoter program end to end, from writing the survey to analyzing the results as an objective third party.
You see NPS across four quarters, the Promoter/Passive/Detractor split, and results cut by team, vertical, or customer type. Also, your report tracks anonymity, follow-up, and usability alongside your NPS Score.
Our analysts code every open-ended comment into a CEO-ready Findings Report, grounded in the TrueData™ model.
Know what moved your NPS and where to act next.
TrueData™ Surveys are for B2B Companies
with High-Value Customer Relationships


A good NPS survey isn’t one click. It’s dozens of steps. We handle them all.
Let’s streamline your survey and give you data you can trust.
Built-In Features that Drive Growth

Software included.
No add-on costs. No upsells. No separate licenses. Just results.

Custom design. Bias-free.
Built from scratch to match your goals—no templates, no leading questions, no fluff.

Thematic insights.
Evidence-based, statistically valid data presented in priority order.

Human-coded text analysis + AI.
Every open-ended response coded for nuance and clarity.

Highest response rates!
100% deliverability. 100% engaging. Surveys customers want to take.

CEO-ready Findings Reports.
Action-focused presentations designed for executives and frontline teams.
Trusted by Companies Like Yours

We supply the oversight, trust, and alignment that AI can’t.
Use AI where it adds value, lose it where it doesn’t. Built for B2B teams that need survey experts, not another DIY tool.
Only Need Software
Level 1
If you already have your survey designed, power it up with the best software and the experts who know how to use it.
$1500-$3000
Complete Design & Deploy
Level 2
All your survey questions, logic flow, rating scales, email campaign, and every other step are managed for you.
$6000-$9900
Get The Analysis Too
Level 3
Crosstabs, correlations, text analysis, dashboards, and findings decks with next-step actions presented to your team.
Avg. $12000-$40000

Need Something More Tailored?
Not every challenge fits neatly into a package. We build custom research and survey strategies for teams with unique goals, complex audiences, or multi-phase initiatives.
How to Calculate Your Net Promoter Score
- Promoters are 9s and 10s
- Passives are 7s and 8s
- Detractors are anything 6 and below
Subtract the percentage of customers who rated you 6 or below from the percentage who rated you 9 or 10, and that’s your NPS. The result lands somewhere between -100 (every customer is a Detractor) and +100 (every customer is a Promoter). Most B2B companies sit between 0 and 50, though benchmarks vary widely by industry.
Fred Reichheld introduced the metric in a 2003 Harvard Business Review article, calling it the single most reliable indicator of company growth. It’s still the most widely tracked customer loyalty metric in B2B.
B2B NPS Benchmarks: What Counts as a Good Score?
A good Net Promoter Score depends on your industry and your peer set. The global average across industries sits around 32, with top-quartile companies landing at 72 or higher (SurveyMonkey benchmark data). That global average hides a lot of variation.
B2B companies typically have a lower NPS than consumer-directed companies. A 2025 industry report puts the median B2C NPS at 49 and the median B2B NPS at 38.
That 11-point gap reflects the difficulty of consistent delivery across complex B2B relationships, where a single customer company may represent five or more stakeholders with different priorities.
Track Your NPS Against Your Own Baseline
For many companies, what matters most is whether their NPS is climbing relative to their past performance and the industry mean. For more details on industry-specific benchmarks, see our deep dive on what counts as a good NPS. Or run the math yourself with our NPS Calculator.
What Net Promoter Score Misses About Customer Relationships
The 0-to-10 scale misses the nuance of the customer experience. A customer who’s mildly disappointed ends up in the same category as one who’s actively telling colleagues to avoid you. In your data, this looks like the same data point, but it’s not.
Also, the question itself isn’t always a fit either. For example, if you sell specialty industrial equipment, asking a procurement officer whether they’d “recommend you” sounds off, because they likely don’t have the time or interest to recommend vendors. Instead, they’re vetting them for their next plant build. That’s why we rework the wording of the question when it makes sense for your particular customers.
For a deconstruction of a survey Lowe’s sent, read Lowe’s NPS Delivery Survey.
Should NPS Surveys Be Anonymous?
Anonymous NPS Surveys deliver more honest answers and get a higher response rate—but that may mean you get a lower score—at first!
The same customer base will yield a measurably different NPS depending on whether the survey is anonymous. We’ve documented this across industries.
For example, in one case, a B2B client in the Automation Industry moved from a non-anonymous survey (customers had to share their names) to our third-party anonymous survey. The result? With the new anonymized survey, we achieved a 15% higher response rate, and the open-ended responses were much richer and more detailed.
However, their Net Promoter Score dropped 15 points, from +4 to -11. Was it worth it? Resoundingly, yes!
We uncovered operational issues that had never been flagged before and that the client could address. In the next NPS Survey, the client reached an NPS of 34 and is now well on its way to the excellent tier of 50+.
The anonymity effect is sharpest in B2B, where customer lists are small, and account relationships are personal.
Customers worry about straining their relationship or triggering an awkward sales follow-up call. A third-party survey with clearly stated anonymity protocols removes both concerns, and the data reflects what your customers actually think.
Of course, not every NPS Survey needs to have the anonymity protocol, but if you want it, we not only build that into your survey but also show respondents how their anonymity will be maintained.
NPS, CSAT, and CES Measure Different Things
These three metrics appear in the same conversations but serve very different purposes. They aren’t substitutes for each other.
Net Promoter Score is the relationship metric. It tracks whether overall loyalty across your customer base is climbing or falling, quarter to quarter. You read it as a trend line, not a snapshot.
Customer Satisfaction Score (CSAT) is often, though not always, transactional, measuring specific interactions such as a support ticket or a delivery.
Customer Effort Score (CES) answers a narrower question: how much work did your customer have to do to get what they needed?
Custom NPS Survey Design for Your B2B Customers
The 0-to-10 question is standard. What we control, and what actually decides whether the data is usable, is the design around it:
- We stick to the standard NPS metrics so you can compare your NPS to benchmarks, but we may tweak the question to align with your industry.
- The follow-up is open-ended and specific. We often ask different follow-up questions to capture what’s going well for promoters and where you can improve the experience for detractors.
- We test the survey across multiple devices. B2B respondents often read their email on phones. If the radio buttons are too small or the text breaks, they’re more likely to abandon your survey.
- Timing is scheduled around your relationship cadence. For instance, we never run surveys during your customer’s known busy season because bad timing produces bad data.
NPS Survey Analysis: Find Your Priorities for Improvement
A baseline score doesn’t fix anything by itself. The improvement work starts after you have the score.
The fastest gains come from closing the loop with detractors. We find out what went wrong so you can see what needs to change. Detractors who get a real response often convert to passives or promoters by the next survey cycle.
Beyond that, we analyze your open-ended comments to uncover key drivers of your NPS. Promoters tell you what’s working. Detractors tell you what isn’t. We code those themes against your business categories so you can see whether the issue sits in product, support, billing, or onboarding, and prioritize fixes accordingly.
For deeper tactics, see our 21 strategies to improve your NPS score.
See What Your NPS Program Could Look Like
Tell us about your customer base, and we’ll show you what a TrueData™ NPS Program would look like for your business.
Bottom line: do you have a current survey? Get a free survey audit. We’ll examine your survey and tell you whether you’re in a good place or how to improve.
Frequently Asked Questions
NPS measures relationship loyalty by asking customers how likely they are to recommend you. CSAT measures whether a specific product, service, or interaction met expectations. NPS is the quarterly relationship benchmark; CSAT is the diagnostic for what’s working or not at the experience level. Most B2B programs run both.
NPS captures one construct (would you recommend us) and tracks it over time. CES captures a different construct (how hard was that to do) tied to a specific transactional moment. NPS tells you whether the relationship is healthy; CES tells you which process is creating friction.
For B2B, an NPS above 30 is solid, above 50 is strong, and above 70 is exceptional. B2B benchmarks run lower than B2C because B2B buying groups have more skeptics in the room. Industry context matters more than the raw number. The trend over time matters more than either.
Subtract the percentage of Detractors (0–6) from the percentage of Promoters (9–10). Passives (7–8) don’t count toward the score but matter for context. The result is a number between –100 and +100.
Relational NPS (the full customer base) belongs on an annual or semi-annual cadence. Transactional NPS (after a specific moment) belongs in a continuous program that suppresses repeat-respondents within a 90-day window. Quarterly NPS to the whole base creates survey fatigue and degrades the data.
Detractor scores predict churn risk better than Promoter Scores predict expansion. A 6 from a strategic account is a leading indicator that should trigger a closed-loop follow-up. The verbatim attached to the 6 is what tells you what to act on.
A 9 from a $5M account and a 9 from a $50K account aren’t the same data point. We weight responses by account value so the headline score reflects the revenue at stake, not just the response count. Operations teams need the unweighted view too; both go on the dashboard.
You can, but it’s usually the wrong tool. NPS measures relationship loyalty; one support call rarely moves that. Post-interaction CES or CSAT will produce better diagnostic data for the moment, and the relational NPS can stay on its annual cadence.
Survey software sends the questionnaire. We design the survey, weight by account value, screen for bias, code the open-ends, and produce the dashboard your leadership team will actually use. The software is the tool; the program is everything else.
More Resources:

What is a Good Net Promoter Score (NPS)?
Key Takeaways: Net Promoter Score (NPS) is a specialized customer loyalty metric that measures the likelihood of a customer recommending a brand to a friend or colleague on a scale of 0 to 10. 66% of companies: This is the proportion of Fortune 1000 companies that rely on Net Promoter Score to benchmark their performance […]

How To Choose Net Promoter Score Vendors, Consultants & Survey Companies
Last Updated: April 3, 2025 When you start shopping for a Net Promoter Score (NPS) partner, you’ll find no shortage of options. From survey platforms to consultants and tech vendors, it can feel like every company is suddenly a Net Promoter Score expert. But what most companies offer is the easy part: sending your NPS […]

How to Improve Your NPS Score: 21 Strategies
Key Takeaways Your Net Promoter Score (NPS) isn’t just another number—it’s a direct reflection of customer trust and customer loyalty. A high NPS means happy customers who are eager to spread the word about your business, fueling growth and strengthening your brand reputation. But here’s the problem: too many companies chase a better NPS the […]

How To Calculate Sample Size & Supercharge Your CX Program
Last Updated: January 10, 2025 Key Takeaways: Clients often ask, “How do we get every customer to take our survey?” But here’s the counterintuitive truth: you don’t need everyone’s feedback to get the real picture, which is why today I am addressing how to calculate sample size. Sampling is the art and science of choosing […]