TrueData™ SURVEYS
TrueData™: The Science of B2B Customer Feedback
Our TrueData™ three-pillar methodology delivers data that holds up to scrutiny.


B2B Survey Experts + Third-Party Objectivity + Software Included
We bring certified analysts (CCXP) and proven methods. And, you’ll have no licensing costs, no learning curve.
Where Ordinary Surveys Fall Short
| Ordinary Surveys | What TrueData™ Delivers | |
| Questions | Pulled from a template | Written to remove bias |
| Sample | Whoever responds | Balanced across segments |
| Analysis | Tallies scores | Explains them |
| Output | A number | What to do next |
| Signal | Surface words | Actual feelings |
True-Facts: Better Questions
True-Facts is the survey design layer. We remove leading language, vague wording, double-barreled questions, and answer choices that nudge respondents toward a particular answer.
Take a common question: “How satisfied were you with our engineer?” It quietly assumes the customer was at least somewhat satisfied. “How would you rate our engineer’s expertise?” doesn’t. The first question fishes for a compliment. The second one collects data.

Let’s Build the Right Survey for You!
Stop settling for surveys that fall short. Let’s build a survey that gives you honest answers, drives action, and accelerates growth.


"*" indicates required fields
True-Tech: Better Data Collection
True-Tech is the survey deployment layer. We use platforms like Qualtrics and Alchemer, but the platform isn’t the methodology. The value comes from how the survey is built, routed, tested, sent, and monitored. That includes sampling plans, role-based logic, invitation language, reminder timing, anonymity settings, and data-quality checks.
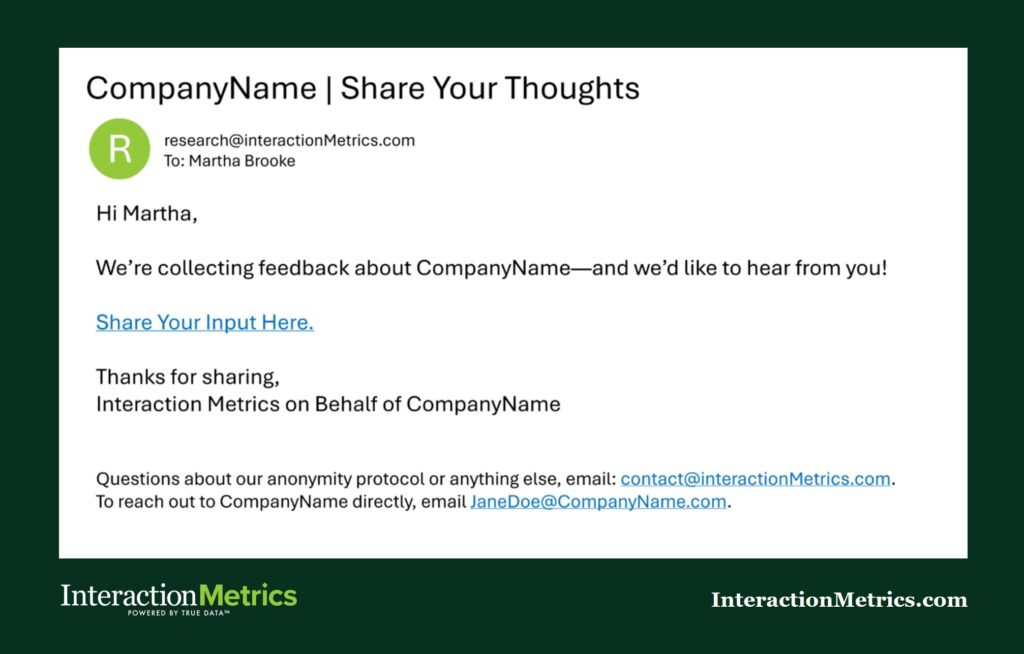
Most companies send surveys from a no-reply address. That single setting tells the customer “we don’t want a real conversation,” and response rates drop.
TrueData™ surveys are always sent from an actual reply-to address. Customers write back, and response rates go up.
True-Insights: Better Analysis
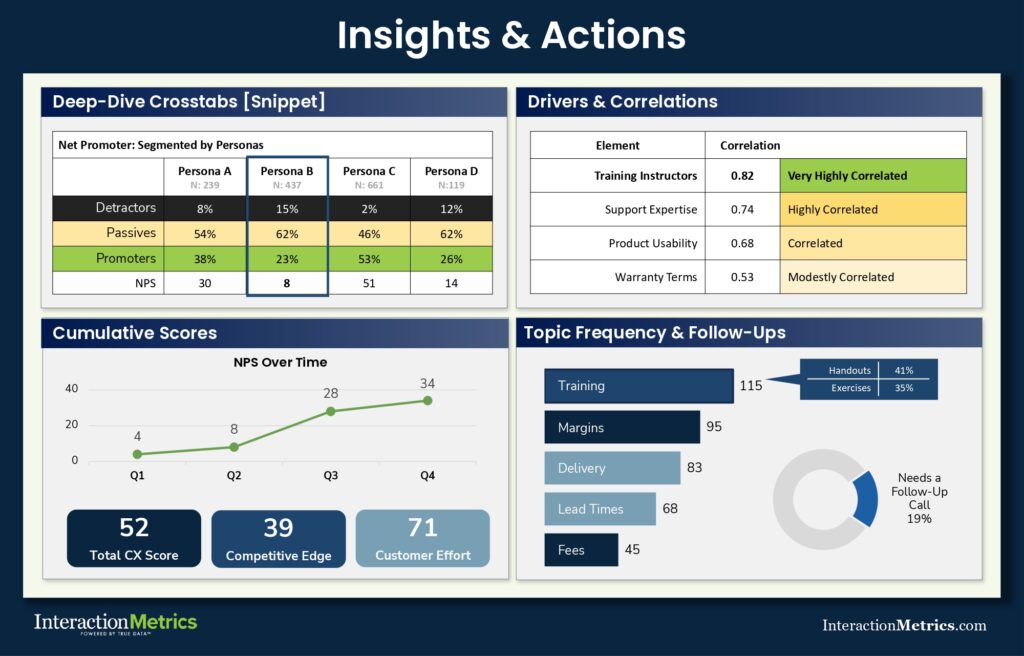
True-Insights is the data analysis layer. It shows what’s driving your scores and where experiences are breaking down.
This pillar includes:
- Human Text Analysis: Reads open-ended responses with context, so themes don’t get flattened into AI summaries or word clouds.
- Quality of Customer Interaction (QCI™): Weights results by what matters most to each customer.
- Crosstabs and Correlations: Show how findings differ by segment and which factors most affect overall experience.
TrueData™ Surveys are for B2B Companies
with High-Value Customer Relationships


A good customer survey isn’t one click. It’s dozens of steps.
We handle them all.
Let’s streamline your survey and give you data you can trust.
Built-In Features that Drive Growth

Software included.
No add-on costs. No upsells. No separate licenses. Just results.

Custom design. Bias-free.
Built from scratch to match your goals—no templates, no leading questions, no fluff.

Thematic insights.
Evidence based, statistically valid data presented in priority order.

Human-coded text analysis + AI.
Every open-ended response coded for nuance and clarity.

Highest response rates!
100% deliverability. 100% engaging. Surveys customers want to take.

CEO-ready Findings Reports.
Action-focused presentations designed for executives and frontline teams.
A Year of Honest Answers
The list below is a handful of real findings from the past year, drawn from hundreds of insights we’ve collected.
- Employees who needed reassignment, or removal from certain roles
- Customer training programs that lacked the depth OEMs needed
- Contracts so laden with jargon that customers decided not to sign
- Distributors who went silent at critical moments, losing sales for our client
- Invoices that didn’t match what was ordered or delivered
- Pricing that felt out of touch with the competition
- Tech support issues that escalated when they should have been handled on the spot
- Service processes that required too many calls and handoffs
Why Ordinary Surveys Lead to Strategic Errors
Most survey data looks factual. But if the questions are biased or the sample is skewed, the numbers point you in exactly the wrong direction. Three failure modes consistently show up in B2B surveys:
Gamed Data. Feedback becomes a tit-for-tat exchange. Customers inflate scores to protect a sales rep or use the survey as leverage for concessions. The result is data about social dynamics, not service quality.
Skewed Samples. Surveys often capture whoever is loudest or easiest to reach, while the quiet majority stays out. A handful of missing accounts can change the whole story.
Inflated Feedback. Standard templates assume satisfaction before the customer answers. “How satisfied were you?” makes it easier to give a polite answer than a specific, critical one — a real problem when customers have ongoing relationships with sales reps, support teams, and account managers.
Each of these failure modes has a fix. They’re the reason TrueData™ exists. Each of these failure modes has a fix. They’re the reason TrueData™ exists.
Frequently Asked Questions
A scientific survey controls for the things that distort results like question bias, social pressure, and sampling errors. Basically, with a scientific survey, research protocols are in place so the findings will hold up under scrutiny.
Because the people who designed those templates had a different goal than you do. Their job was to make surveys that are easy to build; otherwise, it would be hard to sell the survey software.
Basically, templates optimize for build rate. Our custom approach optimizes for truth.
We work almost exclusively with B2B firms in sectors like consulting, heavy manufacturing, robotics, software, and industrial distribution.
Yes. A TrueData™ survey can include any metric you choose, including NPS, CSAT, and CES. The difference is the methodology surrounding the metric, so the score you get is accurate and supported by qualitative analysis.
It depends on the scope, but most surveys are designed, deployed, analyzed, and reported within four to 8 weeks. Tracking studies and multi-wave programs run longer by design.
More Resources:

The Cost of Customer Satisfaction: Survey Program Costs
Last Updated: February 24, 2025 What are typical customer survey program costs? Clients ask this all the time, and the answer varies widely. A simple, off-the-shelf survey might cost very little, while a comprehensive, data-driven program requires a bigger investment. If you’re considering options, surveys can range from quick satisfaction checks to full-scale programs. […]

Top Customer Satisfaction Survey Companies of 2026
Last Updated: April 2, 2026 A great customer satisfaction survey company does more than send a form and count answers. It helps a business ask better questions, hear the right customers, and understand what the feedback means. The right partner helps you measure customer satisfaction in a way that is credible, useful, and tied to […]

What is a Good Net Promoter Score (NPS)? How to Improve NPS With Dashboards, Tracking, and Third-Party Rigor
Net Promoter Score (NPS) is a specialized customer loyalty metric that measures the likelihood of a customer recommending a brand to a friend or colleague on a scale of 0 to 10. 66% of companies: This is the proportion of Fortune 1000 companies that rely on Net Promoter Score to benchmark their performance and improve […]

Rules for Writing B2B Customer Satisfaction Survey Questions
Last Updated: February 10, 2026 Effective B2B customer satisfaction surveys are designed to produce decisions, not just data. To move beyond generic ratings, B2B firms must use role-based routing, suppression strategies, and expectation-gap mapping. This guide outlines the essential rules for transforming B2B surveys into strategic assets that protect revenue and improve customer retention. The […]