TrueData™ SURVEYS
Sampling & Measurement
A Guide to Sample Size, Response Rate, and Reliable Measurement


B2B Survey Experts + Third-Party Objectivity + Software Included
We bring certified analysts (CCXP) and proven methods. And, you’ll have no licensing costs, no learning curve.
Survey Sampling and Measurement
| Survey Aspect | Usual Way | Better Way | TrueData™ Delivers |
| Sampling Logic | Sending the survey to whoever is available. | Defining the population first and selecting the right mix of customers. | Results that better represent the customers you need to understand. |
| Respondent Mix | Assuming the final respondent pool reflects the full customer base. | Reviewing the mix by role, segment, account type, region, or other key groups. | Less distortion from overrepresented groups. |
| Sample Size | Aiming for a total number that looks large enough overall. | Planning sample size around precision and subgroup analysis. | More granular findings with segment-level insight. |
| Response Rate | Treating response rate as the main signal of survey quality. | Examining who responded, who did not, and whether key groups are represented. | Findings that reflect the customer base, not just those most likely to respond. |
| Trend Measurement | Comparing scores over time when the survey or respondent mix have changed. | Keeping questions, scales, and respondent mix stable over time. | Longitudinal studies that reflect real change. |
| B2B Measurement | Treating every response as equal. | Accounting for account size, role, and strategic importance. | Findings that better reflect the reality of high-value customer relationships. |
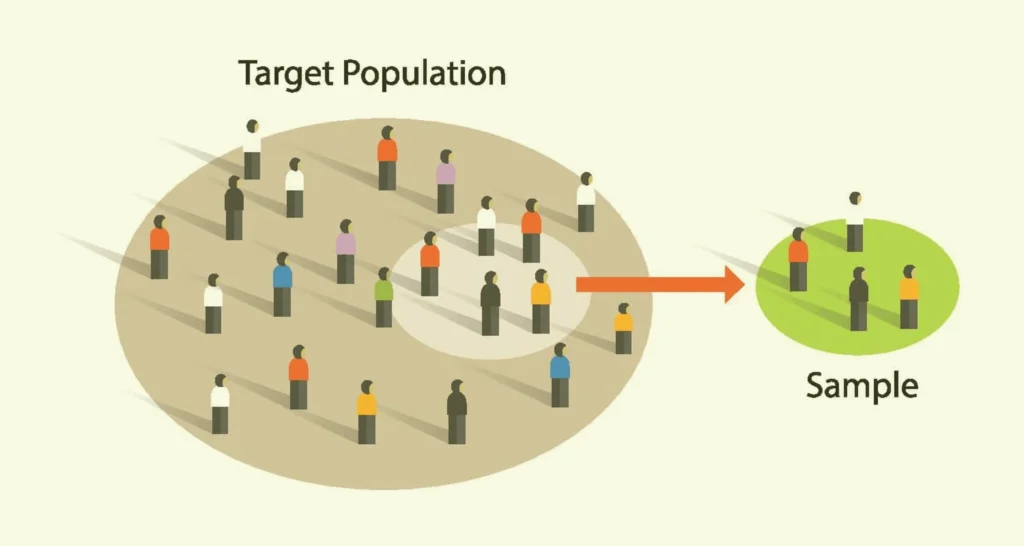
Population vs. Sample
Your population is the full group whose experience you want to understand. Your intended sample is the subset selected for the study.
Your respondent pool is who actually completes the survey. When those groups diverge too much, the findings stop describing the population and start describing only the people who answered.
Let’s Build the Right Survey for You!
Stop settling for surveys that fall short. Let’s build a survey that gives you honest answers, drives action, and accelerates growth.


"*" indicates required fields
Use Our Sample Size Calculator
If you plan to use survey results to make business decisions, sample size matters. This free calculator helps you estimate how many responses you need for results you can rely on. Just enter:
- Your total population size
- Your confidence level
- Your acceptable margin of error
Need help designing a survey that supports statistically sound findings? Get in touch. We can help.

What Is a Good Survey Response Rate?
There is no universal “good” response rate. What counts as reasonable depends on the audience, the relationship, the timing, and how representative the final respondent pool is.
This chart shows how the number of responses needed changes with population size, but even a strong response count does not guarantee a representative sample.
A program chasing a response rate percentage without asking who’s responding and who isn’t is measuring the wrong thing.
TrueData™ Surveys are for B2B Companies
with High-Value Customer Relationships


A good customer survey isn’t one click. It’s dozens of steps.
We handle them all.
Let’s streamline your survey and give you data you can trust.
Built-In Features that Drive Growth

Software included.
No add-on costs. No upsells. No separate licenses. Just results.

Custom design. Bias-free.
Built from scratch to match your goals—no templates, no leading questions, no fluff.

Thematic insights.
Evidence based, statistically valid data presented in priority order.

Human-coded text analysis + AI.
Every open-ended response coded for nuance and clarity.

Highest response rates!
100% deliverability. 100% engaging. Surveys customers want to take.

CEO-ready Findings Reports.
Action-focused presentations designed for executives and frontline teams.
Trusted by Companies Like Yours
The Difference Between Survey Data and Reliable Findings
A well-designed survey still produces bad data if the wrong people answered it. Too few responses, the wrong mix of respondents, or a sample that overrepresents whoever was easiest to reach — any of these can produce findings that look credible and aren’t. The questions might be excellent. The problem is upstream of them.
Sampling and measurement are where survey rigor either holds or falls apart. They determine whether your findings reflect the customer base you think they reflect — or just reflect who happened to respond on a given day.
In B2B and high-value programs, this is especially consequential. A skewed sample in a 50-account relationship program isn’t a statistical footnote. It’s a distorted picture of your most important customer relationships, and the decisions made from it carry real risk.
Whether you realize it or not, your sampling approach reflects a broader choice: science-first or conventional.
The conventional approach is to send the survey to your contact list, accept whatever response rate you get, and run the analysis on what comes back. Qualtrics and Alchemer will generate charts from that data. The problem is that what comes back is rarely a clean, representative sample — some contacts respond twice from different devices, some accounts send the wrong person, some segments consistently over-respond while others go quiet. A platform dashboard won’t flag any of that.
A science-first approach treats sampling as a methodology decision: who should be in this survey, in what proportions, and how do you verify that what you’re analyzing reflects the population you intended to measure? That’s what separates a score from a finding you can actually stand behind.
What Is Survey Sampling and Why Does It Matter?
Survey sampling is the process of deciding who is invited to a survey so the results represent the population you’re trying to understand.
The distinction between a sample and a population matters more than it might seem.
In large consumer programs, sampling imperfections tend to average out. In a B2B program with a defined account list, they compound. When your population is 60 accounts, a census — surveying every contact rather than a subset — is often more appropriate than sampling at all. Every non-response is a meaningful gap, not a rounding error.
What Are the Main Survey Sampling Methods?
Sampling methods fall into two broad categories, each with different implications for what you can conclude from the data.
Probability Sampling
In probability sampling, every member of the population has a known, non-zero chance of being selected. Random sampling, stratified sampling, and systematic sampling all fall here. The key advantage is that probability sampling supports statistical inference — you can generalize from the sample to the broader population with a measurable degree of confidence.
Stratified sampling is particularly useful in CX programs. Rather than sampling randomly from the full list, you divide the population into meaningful segments — by account size, role, region, or product line — and sample from each. This ensures smaller but important segments don’t get swamped by larger ones in the data.
Non-Probability Sampling
Convenience sampling, quota sampling, and purposive approaches are faster and easier to execute, but they don’t support the same statistical claims. When you survey whoever is easiest to reach, you’re making an implicit assumption that those people represent the broader population — an assumption that’s often wrong and rarely tested. Non-probability sampling isn’t always the wrong choice, but its limitations need to be reported honestly rather than treated as if the data were fully representative.
When Does B2B Change the Sampling Calculus?
B2B programs have a structural challenge that consumer programs don’t: small populations and multiple stakeholders per account. A single account might have a procurement contact, a day-to-day operations user, and an executive sponsor — each with a genuinely different view of how the relationship is going. Surveying only one of them, or averaging across all of them without accounting for role, misrepresents the account.
This is also where contact list quality matters more than most programs acknowledge. If your list is outdated, if it overrepresents one region or customer type, or if account managers have informally shaped who gets included, your sample has a bias baked in before a single invitation goes out.
How Do You Measure Customer Experience When It’s Broad and Complex?
Customer experience isn’t one thing. It spans sales, onboarding, delivery, service, billing, and ongoing account management — and different people in the same account interact with different parts of it. Trying to measure all of it in a single survey is a design error. The result is a survey that’s too long, too generic, and too diluted to produce findings anyone can act on.
Before sampling decisions can be made, there’s a prior question: what slice of the experience are you measuring, and for whom? A post-delivery survey has a different population than a relationship survey. A touchpoint-specific survey targets different respondents than an annual account review. Getting that scope wrong means the sample — however carefully constructed — is answering a different question than the one you needed.
This is also where the transactional vs. relationship distinction matters. Transactional surveys measure a specific interaction while it’s fresh. Relationship surveys measure the broader account experience over time. They require different timing, different respondent selection, and different questions. Running one when you need the other produces data that looks relevant and isn’t.
In B2B programs with multiple customer types — OEMs, distributors, end-users, and others — your measurement framework needs to account for the fact that each group’s experience looks different. A customer experience measurement framework that doesn’t distinguish between them will produce aggregate findings that accurately describe none of them.
Sample Size, Margin of Error, and the Precision You Actually Need
Sample size determines how confident you can be in your findings — not how credible they look. A large, unrepresentative sample produces confident-looking data that’s wrong. A smaller, well-constructed sample can produce findings that are genuinely trustworthy, as long as you’re honest about the precision they support.
Margin of error is the practical expression of that confidence. When you report a satisfaction score of 7.8, what you’re really reporting is 7.8 ± something — and the size of that something depends on your sample. Reporting scores to a decimal point without knowing the margin of error isn’t precision. It’s false precision, and it leads to decisions made on differences that aren’t statistically real.
Confidence levels — 90%, 95%, 99% — express how certain you are that your findings would hold if you measured the full population. A 95% confidence level is standard in most research contexts, but it comes at a cost: higher confidence requires larger samples. The right level depends on what’s at stake in the decisions being made from the data.
What Is a Good Sample Size for a Survey?
There’s no universal answer. The right sample size depends on your total population, the precision you need, how you plan to use the results, and whether you need to analyze subgroups separately. A sample that looks adequate at the total level may be too thin to support meaningful segment-level findings — which is often where the most important insights live.
In B2B programs, the population itself often dictates the approach. If you have 40 accounts, the question isn’t what sample size to target — it’s how to get meaningful coverage across all of them. When every account matters, sample size planning and census planning often converge.
Why Subgroup Analysis Should Drive Sample Size Decisions
If you plan to analyze results by segments like account tier, customer type, region, or role — and in most B2B programs, you should — your sample size needs to be large enough to support those cuts, not just the overall total. The smallest subgroup you need to analyze is what should drive your sample size target, not the largest or the average.
A program that produces statistically valid overall scores but tissue-thin segment findings has solved the wrong problem. Knowing that satisfaction is 7.4 overall tells you less than knowing that it’s 6.1 among distributors and 8.2 among direct accounts — but you can only make that comparison reliably if you designed the sample to support it.
Response Rate, Representativeness, and Why They’re Not the Same Thing
Response rate is easy to measure. Representativeness is what actually matters. A 60% response rate from a skewed sample is less useful than a 30% response rate that accurately reflects the full population — and conflating the two is one of the more common mistakes in CX measurement.
Who responds to a survey is rarely a random cross-section of who was invited. Contacts who are highly engaged with your organization, or highly frustrated with it, tend to over-respond. Contacts in the middle — the quiet majority whose experience is probably closer to the norm — are underrepresented. That self-selection pattern doesn’t show up in a response rate metric, but it shows up in the data.
Why a Strong Response Rate Can Still Produce Biased Results
Sample selection bias is the gap between who was invited and who responded — and it’s present in almost every survey. The most dissatisfied customers respond at high rates because they have something to say. Satisfied customers, especially in high-touch B2B relationships, often don’t respond because everything seems fine and the survey feels optional. The result is data that skews toward the extremes and underrepresents the middle.
Non-response bias should be examined, not just acknowledged. Early responders, late responders, and non-responders often differ in meaningful ways. If they do, that affects how much confidence you can place in the findings and how carefully they need to be interpreted.
Survey Reliability and Validity — The Difference and Why Both Matter
Reliability is about consistency. Validity is about whether the survey is measuring the thing it claims to measure. You need both, but validity matters first. A survey can produce the same score every wave and still be measuring the wrong thing.
Designing for reliability means keeping scales consistent, standardizing how the survey is administered, and controlling for changes in context that would make results incomparable over time. Designing for validity means starting with a clear construct definition, using questions that actually capture that construct, and testing the instrument before deploying it at scale.
A reliable but invalid survey gives you confident, reproducible data about the wrong thing. “We’ve always measured it this way” is not a validity argument — it’s how programs spend years collecting data that doesn’t connect to the decisions that matter.
Longitudinal Survey vs. Repeated Cross-Sectional Survey
A longitudinal survey tracks the same respondents over time. It shows how individual perceptions change, which is valuable when you want to understand what drives shifts at the relationship level. A repeated cross-sectional survey draws a new sample from the same population each wave. It shows how aggregate sentiment shifts — useful for population-level trend analysis, but it can’t tell you whether the same accounts are improving or whether the composition of respondents changed between waves.
Which approach fits depends on what question you’re trying to answer. If you need to know whether your top-tier accounts are trending better or worse, longitudinal tracking is the right structure. If you need to know whether customer sentiment across your full market has shifted, repeated cross-sectional works. Using one when you need the other produces trend lines that are technically real and practically misleading.
What Is a Tracking Study?
A tracking study measures the same constructs against the same population on a regular cadence — quarterly, semi-annually, annually. The value is in comparison over time, which means the methodology has to stay stable. Change the question wording, adjust the scale, shift the sample composition, or switch survey modes between waves, and you’ve broken the trend line. The numbers will keep coming; they just won’t be telling you what you think they are.
Panel Surveys
A panel survey recruits a defined group of respondents and surveys them repeatedly over time. The advantage is control — you know exactly who’s in the study, and you can attribute changes to shifts in experience rather than shifts in who’s responding. The risk is panel conditioning: respondents who’ve taken the same survey multiple times start to answer differently, not because their experience has changed but because the survey itself has become familiar. Attrition is also a factor; panels erode over time, and the people who stay may not be representative of those who leave.
How to Track CX Over Time Without Misleading Yourself
Trend analysis is only as valid as the consistency of the measurement behind it. Before interpreting movement in your scores, ask what else changed: did you adjust a question, expand the sample to a new segment, switch from email to phone administration, or change your scale? Any of those can produce apparent trends that reflect a methodology change rather than a real shift in customer experience.
Internal benchmarks — your own scores over time — are almost always more actionable than external industry comparisons. External benchmarks vary widely in methodology, population, and scale, which makes apples-to-apples comparison difficult to validate. Your own trend line, measured consistently, tells you something you can actually do something with.
Special Considerations for High-Value and B2B Measurement
In high-volume consumer programs, sampling errors tend to average out across thousands of responses. In a B2B program with 60 accounts, they compound. A single misclassified segment, a cluster of non-responses from one account tier, or a contact list that overrepresents one region can shift the overall results in ways that don’t reflect reality — and in a small dataset, those shifts won’t self-correct.
Account-level vs. contact-level thinking is one of the more important distinctions in B2B measurement. If you aggregate individual responses to an account-level score without weighting by strategic importance, a troubled major account can look fine in the overall numbers because it’s outvoted by satisfied smaller ones. Weighting by revenue, strategic tier, or relationship stage gives the data a structure that reflects how the business actually works.
Over-surveying is a real risk in high-value programs. Sending surveys too frequently to key accounts doesn’t just inflate response fatigue; it signals that you’re not paying attention to how much you’re asking of people who have other things to do. That perception affects the relationship you’re trying to measure, which means your frequency decisions and your data quality are connected in ways they aren’t in consumer programs.
There are also situations where a structured survey isn’t the right instrument. When an account is strategically critical, when the relationship is sensitive, or when the population within an account is too small for quantitative findings to hold up, a structured interview produces richer data and often stronger response rates. The choice between survey and interview is a measurement decision, not just a logistics one.
The Bottom Line
The difference between decorative scores and decision-ready findings usually starts here. If the sample is weak, the respondent mix is skewed, or the measurement framework is too broad, the results will look cleaner than they are. Strong sampling and measurement produce data that is more valid, more granular, and much more useful for real decisions.
That is the standard we use at Interaction Metrics. We design survey programs so the results reflect the customer relationships leaders actually need to understand.
Contact us to talk through what a more rigorous sampling and measurement approach would look like for your program.
More Resources:

Top Customer Satisfaction Survey Companies of 2026
Last Updated: April 2, 2026 A great customer satisfaction survey company does more than send a form and count answers. It helps a business ask better questions, hear the right customers, and understand what the feedback means. The right partner helps you measure customer satisfaction in a way that is credible, useful, and tied to […]

Rules for Writing B2B Customer Satisfaction Survey Questions
Last Updated: February 10, 2026 Effective B2B customer satisfaction surveys are designed to produce decisions, not just data. To move beyond generic ratings, B2B firms must use role-based routing, suppression strategies, and expectation-gap mapping. This guide outlines the essential rules for transforming B2B surveys into strategic assets that protect revenue and improve customer retention. The […]

How To Calculate Sample Size & Supercharge Your CX Program
Last Updated: January 10, 2025 Clients often ask, “How do we get every customer to take our survey?” But here’s the counterintuitive truth: you don’t need everyone’s feedback to get the real picture, which is why today I am addressing how to calculate sample size. Sampling is the art and science of choosing the […]

How to Avoid Survey Fatigue
Last Updated: June 16, 2025 Never a day goes by that I don’t receive a survey request—sometimes multiple ones. I bet that’s true for you too. In 2013, SurveyMonkey processed approximately 1 million survey responses per day. By 2014, that number had already more than doubled to 2.2 million per day. And now? By 2025, SurveyMonkey […]