TrueData™ SURVEYS
Client Success Metrics: Reporting that Builds Trust
Get polished, client-ready reports that show the steps you’re taking to boost satisfaction, loyalty, and trust.


B2B Survey Experts ﹡ Third-Party Objectivity ﹡ Software Included
We bring certified analysts, proven methods, and everything you need. No licensing costs, no learning curve.
Metrics that Actually Matter to Your Clients
Client success metrics translate feedback into meaningful results. These include client satisfaction metrics, delivery performance, and project-specific KPIs—all surfaced through clear client dashboards and reports.
Good client experience metrics go beyond the numbers: they tell a story of progress, responsiveness, and value delivered over time.
Take this Survey for a Test-Drive ➔
Reports that Show You’re Listening
Survey software gives you charts. We give you meaning. Our client reporting goes beyond dashboards to highlight what’s working, what’s at risk, and what to do next.
Whether a client is a promoter or a detractor, the goal is the same: show them you listened—and that their feedback drives action. That’s how you keep clients confident and engaged with your company.
Let’s Build the Right Survey for You!
Stop settling for surveys that fall short. Let’s build a survey that gives you honest answers, drives action, and accelerates growth.


"*" indicates required fields

A good customer survey isn’t one click. It’s dozens of steps.
We handle them all.
Let’s streamline your survey and give you data you can trust.
Built-In Features that Drive Growth

Save money. Software included.
No add-on costs. No upsells. No separate licenses. Just results.

Custom design. 100% bias-free.
Built from scratch to match your goals—no templates, no leading questions, no fluff.

Insights grouped by themes.
Evidence based, statistically valid data presented in priority order.

Human-coded text analysis + AI-assists.
Every open-ended response coded for nuance and clarity.

Highest response rates!
100% deliverability. 100% engaging. Surveys customers want to take.

CEO-ready Findings Reports.
Action-focused presentations designed for executives and frontline teams.
TrueData™ Surveys are for B2B Companies
with High-Value Customer Relationships


Trusted by Companies Like Yours
Let’s Build the Right Survey for You!
Stop settling for surveys that fall short. Let’s build a survey that gives you honest answers, drives action, and accelerates growth.
"*" indicates required fields
Only Need Software
Level 1
If you already have your survey designed, power it up with the best software and the experts who know how to use it.
$1500-$3000
Complete Design & Deploy
Level 2
All your survey questions, logic flow, rating scales, email campaign, and every other step are managed for you.
$6000-$9900
Get The Analysis Too
Level 3
Crosstabs, correlations, text analysis, dashboards, and findings decks with next-step actions presented to your team.
Varies by Complexity
Need Something More Tailored?
Not every challenge fits neatly into a package. We build custom research and survey strategies for teams with unique goals, complex audiences, or multi-phase initiatives.

What Bad Surveys Cost You
Bad surveys create blind spots—missed problems, wasted effort, and lost customers.
In this free guide, you’ll learn the five most common survey mistakes—and how to fix them.
You’ll see examples of better survey questions, proven ways to boost response rates, and how to turn survey data into insights your teams can actually use.
Get our Free Guide and stop bad data in its tracks.
Frequently Asked Questions
Client success metrics are data points that track how well you’re meeting your clients’ needs over time. These include client satisfaction metrics, delivery performance, communication responsiveness, and overall value delivered. They’re essential for identifying what’s working—and what’s not—in your client relationships.
While the two sound similar, client success metrics are typically used in B2B environments and often focus on long-term relationships, complex services, and project-based engagements. Customer success metrics often apply to individual consumers in transactional settings. Our approach to client metrics includes project review data, client dashboards, and detailed post-project evaluations.
A strong client satisfaction report should combine client experience metrics with clear context. It should include quantitative data like customer satisfaction scores, Net Promoter Scores (NPS), and Customer Effort Scores (CES), as well as qualitative feedback and open-ended insights. The best reports also include recommendations and highlight areas of improvement.
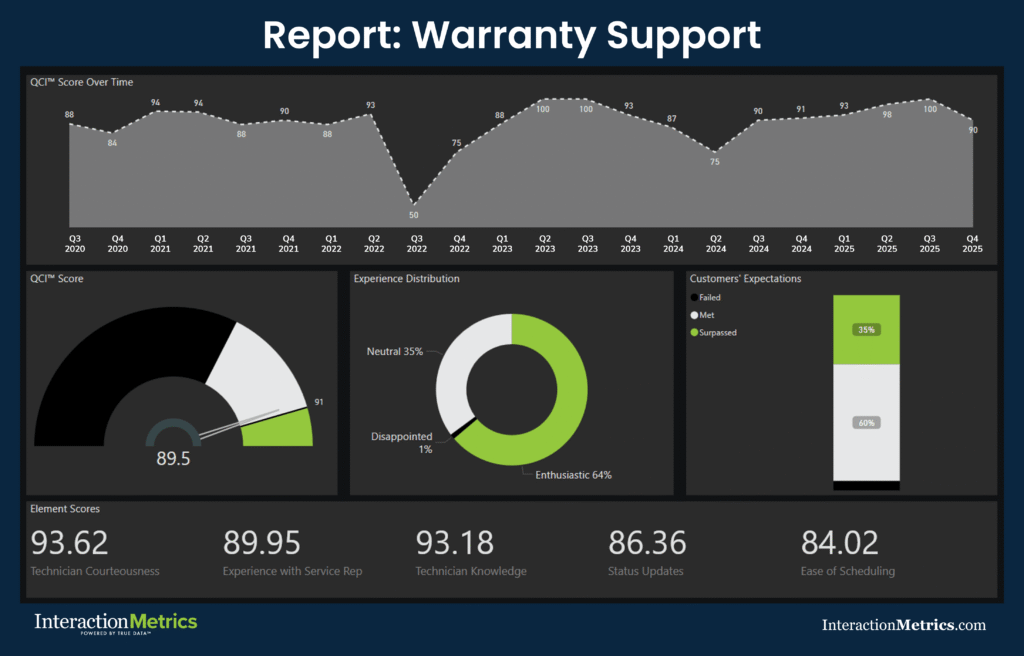
Client dashboards provide an at-a-glance view of satisfaction trends, support requests, delivery timelines, and KPIs. But a great dashboard doesn’t just show numbers—it tells a story. We design dashboards that help you track client sentiment, show responsiveness, and demonstrate that you’re acting on feedback. That’s key to building trust and driving repeat business.
The best way to measure customer satisfaction levels is through a combination of quantitative and qualitative methods. That includes using customer satisfaction surveys, Net Promoter Score (NPS), and Customer Effort Score (CES) alongside direct customer feedback and open-ended responses. With this approach, you capture both the score—and the “why” behind it.
Net Promoter Score (NPS) measures customer loyalty by asking how likely a client is to recommend your services. Customer Effort Score (CES), on the other hand, asks how easy it was for the client to accomplish a task or resolve an issue. NPS helps predict future loyalty, while CES pinpoints friction in the customer journey.
It means showing clients that their feedback prompted change. Our client reporting surfaces key metrics and client insights—but more importantly, it connects those metrics to actions. This includes follow-up questions, recommendations, and evidence of improvements. When clients see that their voices drive better service, trust grows.
Absolutely. Some stakeholders care about delivery timelines; others care about long-term customer retention or reputation management. We tailor every client satisfaction report and dashboard to your audience—whether that’s internal teams, executive sponsors, or the client themselves.
Common key performance indicators (KPIs) in client reports include:
- Customer satisfaction score (CSAT)
- Net Promoter Score (NPS)
- Customer Effort Score (CES)
- Project delivery accuracy and timelines
- Support request resolution time
- Client feedback response rate
- Churn rate and renewal status
We’ll help you choose KPIs that align with your goals and track them over time.
Reputation management starts with honest feedback and meaningful metrics. By tracking customer sentiment, identifying areas of concern, and highlighting progress in client dashboards, our reporting helps you build a reputation for responsiveness and results. We also help you follow up on survey responses to turn detractors into promoters.
Deep Dive: Because You’re Here for the Details
You stayed with us this far, so you’re not just browsing—you’re building. Let’s get into it.
What Are Client Success Metrics and Why Do They Matter?
Client success metrics are the foundation of strong B2B relationships. They quantify how well your company meets client needs—and, when analyzed thoughtfully, they uncover what’s driving satisfaction, loyalty, and trust.
But metrics alone aren’t enough. Without meaningful interpretation, they’re just numbers in a dashboard.
At Interaction Metrics, we transform raw data into client-ready reports that explain why satisfaction rises or falls. From Net Promoter Score (NPS) and Customer Effort Score (CES) to project review feedback and delivery timelines, every data point is put into context.
The result? Clear, credible reporting that builds client confidence—and lays the groundwork for future projects.
Going Beyond Customer Satisfaction Scores
Most companies measure customer satisfaction using a single score or survey. But that approach misses the nuance of the client journey. Client satisfaction metrics must include more than a simple rating—they should reflect how responsive, reliable, and valuable your company appears across the full lifecycle of service delivery.
We start by measuring customer satisfaction levels using a blend of metrics: CSAT surveys, Net Promoter Score, and Customer Effort Score. But we don’t stop there. We incorporate direct customer feedback and qualitative insights, then segment results by touchpoint and client type. This shows what’s driving high satisfaction—and where you’re at risk of churn.
The Power of Context in Client Reporting
Client reporting is only valuable if it’s easy to interpret and tells a coherent story. Charts are a start, but not the finish. Our reports are designed to be user friendly and context-rich, combining survey data with commentary that explains what each metric means for your business decisions.
For example, if your NPS score drops quarter-over-quarter, we don’t just flag the number—we look at customer sentiment, follow-up questions, and delivery metrics to explain why. Did something change in your support team’s responsiveness? Were there missed handoffs between teams? Did you prompt customers to give feedback too early or too late in the journey?
Our reports answer these questions—and show what to do next.
Client Dashboards vs. Meaningful Feedback
Client dashboards often present polished charts, but they rarely deliver actionable feedback. That’s because most dashboards rely on software alone, not critical thinking.
We use several tools—like advanced survey software, text analysis, and project-specific KPIs—but the real differentiator is the human expertise we apply to interpret them.
Our dashboards are layered: on the surface, clients see key metrics like satisfaction trends and churn rate. Beneath that, they’ll find summaries of support requests, customer issues, and delivery accuracy. At the deepest level, we include narrative insights—explaining why metrics shifted and how you responded.
This layered approach boosts reputation management by proving that your company is paying attention and taking action.
Need better participation in your survey programs? Learn How to Improve Your Survey Response Rate.
What Makes a Great Client Satisfaction Report?
A truly effective client satisfaction report doesn’t just document metrics—it demonstrates progress. It shows that you’re measuring what matters, following up with customers, and improving over time.
That’s why every report we create includes:
- Quantitative metrics like NPS, CES, and overall satisfaction
- Qualitative feedback from open-ended survey responses
- Trends over time to measure customer loyalty and churn risk
- Insights about key drivers of satisfaction or dissatisfaction
- Concrete next steps for account teams and service leaders
These elements combine to deliver accurate insights that your clients can trust—and that your teams can act on.
Tracking the Right Metrics for Client Health
Too often, companies rely on vanity metrics that make them feel good but say little about the real customer experience. Instead, we focus on the metrics that correlate with retention, repeat business, and customer lifetime value.
Depending on your industry and goals, client success metrics might include:
- Net Promoter Score (NPS)
- Customer Effort Score (CES)
- Support resolution time
- On-time delivery rate
- Resource allocation accuracy
- Survey response rates
- Project-specific KPIs
- Customer churn rate
These metrics align with what leaders in customer success track. For example, Gainsight outlines 10 top customer experience metrics that matter most—from onboarding efficiency to sentiment trends—reinforcing the value of a multi-metric approach.
How Many Responses Do You Really Need to Trust Your Metrics?
Before drawing conclusions from your client satisfaction data, make sure your sample size is statistically sound. Too few responses can distort your insights—too many wastes time and resources.
The chart below shows how many responses are needed to draw reliable conclusions based on your client population:

Measuring Customer Loyalty through the Client Lens
Client loyalty doesn’t happen by accident. It’s built through repeated proof that your company listens, learns, and evolves. That’s why we help you not only measure customer loyalty—but predict it.
Using a combination of satisfaction scores, direct feedback, and client-specific insights, we identify the patterns that signal loyalty—or risk. Is your average time to resolve support issues slipping? Have long-term clients given fewer follow-up responses lately? These subtle shifts can reveal deeper issues before they become deal-breakers.
Our goal is to provide you with metrics that don’t just reflect the past—they help shape the future.
From Survey Responses to Strategic Recommendations
Survey responses are a goldmine—if you know how to mine them. We don’t just count how many clients answered. We analyze what they said, how they said it, and what it means for your business.
Whether it’s qualitative feedback about delays or honest feedback about inconsistent service, we filter out noise and surface what’s actionable.
Customer feedback drives results when it’s paired with context. That’s why we combine open-ended comments with quantitative metrics, using a blend of human analysis and machine learning to detect frustration, delight, confusion, and apathy—all the emotional signals that standard dashboards miss.
This hybrid approach transforms unstructured feedback into strategic direction. Whether you’re redesigning support workflows, refining product features, or improving handoffs between departments, our analysis highlights exactly where to act—and why.
One way we visualize qualitative data is by tagging every comment for topic and sentiment, then organizing those insights to reveal what’s most common and most urgent.

Our team looks at survey templates, timing, and prompting methods to ensure you get the highest-quality responses. And we map open-text feedback back to client personas, support issues, and delivery milestones to provide a 360-degree view of satisfaction.
Using Metrics to Reduce Churn and Drive Growth
If you want to reduce churn and grow your customer base, tracking client success metrics is critical. But growth comes not just from tracking—it comes from understanding.
That’s where we come in.
We help you:
- Identify areas of friction in the customer journey
- Track customer sentiment across different projects and departments
- Follow up with detractors to recover trust
- Use feedback from current customers to improve onboarding for new customers
- Show decision-makers how your support team and operations team are improving over time
With this depth of insight, you’re not just reacting to issues—you’re proactively building a better client experience.
From Metrics to Messaging: Reputation Management in Action
In today’s competitive landscape, your reputation is your edge. Metrics play a crucial role in reputation management by making your progress visible and credible. We help you use NPS, CES, and satisfaction levels to demonstrate improvement, transparency, and accountability.
When clients see that you measure customer experience regularly—and act on the results—they’re more likely to remain loyal. And when your reporting includes follow-up questions, next steps, and client insights, you turn survey results into stories worth sharing.
That’s the essence of great client reporting: not just measurement, but meaning.
Why Work With Us
At Interaction Metrics, we offer more than survey software or dashboards. You get a science-based, human-driven system for capturing, interpreting, and communicating client success. Our TrueData™ model combines accurate feedback, reputation analysis, and contextual reporting to help you keep clients satisfied—and eager to continue the relationship.
Whether you’re preparing for a post-project evaluation or planning long-term account strategy, we provide the metrics and insights that move you forward.
Ready to Show Clients You’re Listening?
We help you go beyond metrics to tell a story of success, trust, and responsiveness. If you’re ready to upgrade your client dashboards, reports, and satisfaction tracking:
Contact us today to get started with reporting that actually builds trust.
Let’s Build the Right Survey for You!
Stop settling for surveys that fall short. Let’s build a survey that gives you honest answers, drives action, and accelerates growth.
"*" indicates required fields