TrueData™ SURVEYS
B2B CX Case Studies: TrueData™ in Practice
Our TrueData™ method moves the KPIs that matter most: Churn rate, revenue, and customer advocacy.


B2B Survey Experts + Third-Party Objectivity + Software Included
We bring certified analysts (CCXP) and proven methods. And, you’ll have no licensing costs, no learning curve.
B2B Case Study: How Yaskawa America Earned the Outstanding Customer Experience Award
In Brief: Yaskawa America’s Drives & Motion Division measures CX with Interaction Metrics year over year. In 2025: an overall score of 90 and an NPS of 66.
Executive Summary
Yaskawa America’s Drives & Motion Division has been measuring customer experience with Interaction Metrics since 2014. Not a survey. A longitudinal study, run the same way every year, on a client we know well and work with closely.
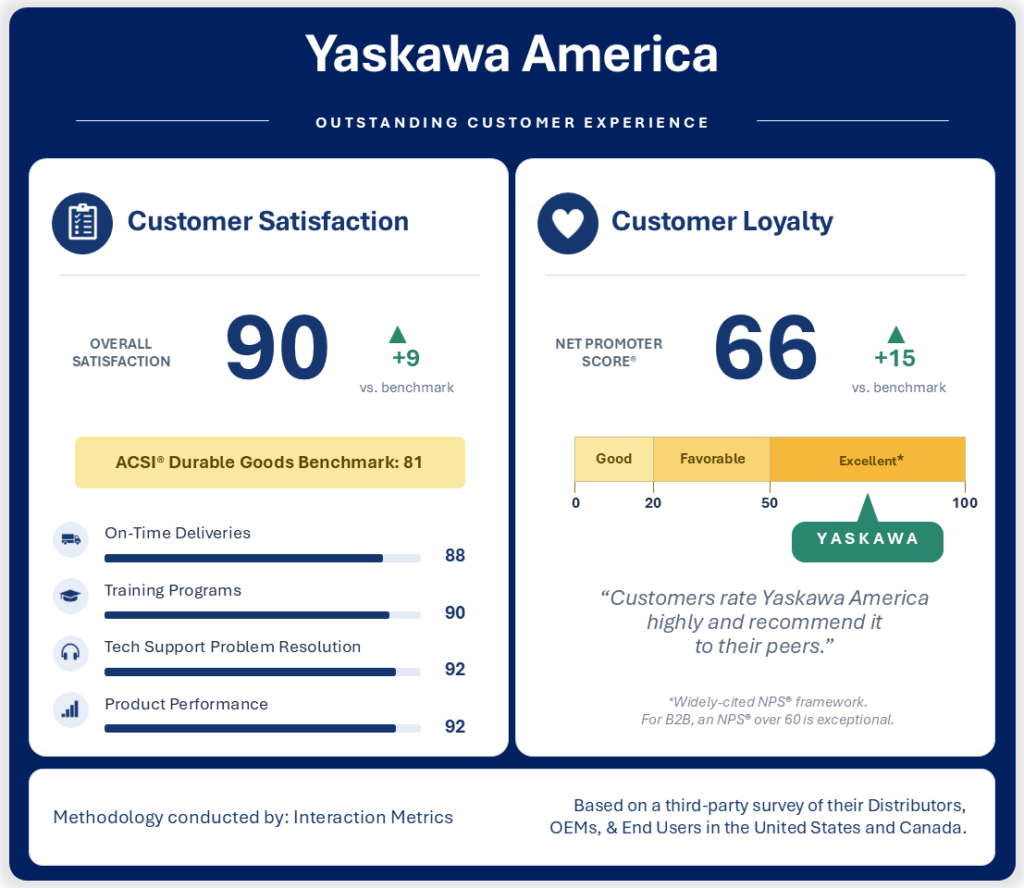
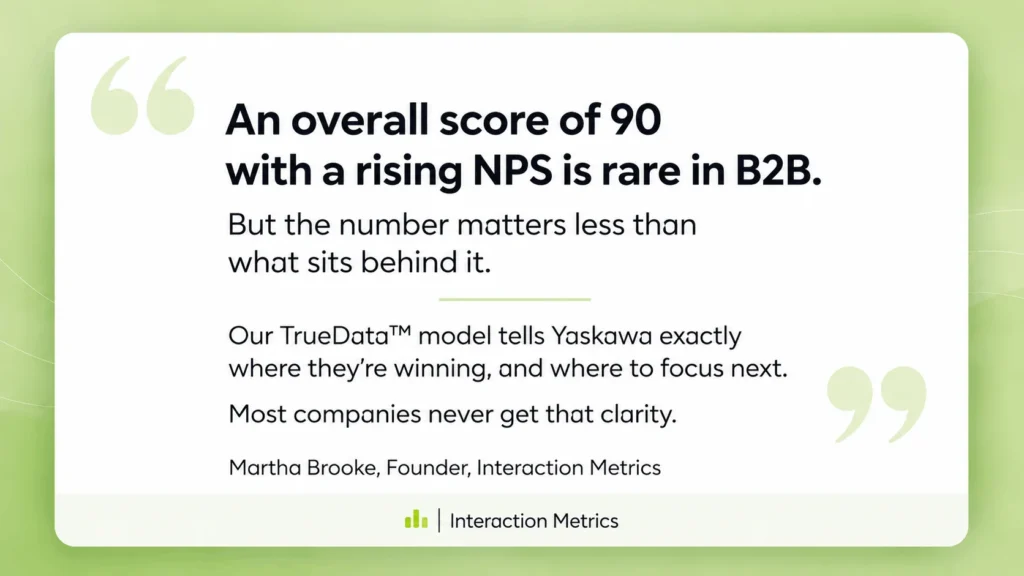
Over that decade, Yaskawa earned recognition from us more than once. What they had never earned was the Outstanding Customer Experience Award, our highest level. In 2025, they did, with an overall score of 90 out of 100 and a Net Promoter Score of 66 from more than 2,800 distributors, OEMs, and end users across the United States and Canada.
That distinction is the story. The award is not a good year. It is the top of an eleven-year climb we tracked the entire way.
The Challenge: Three Customer Types, and a Moving Target
Drives & Motion equipment goes into semiconductor fabs, packaging lines, HVAC-R systems, food and beverage plants, and many other industries. Yaskawa reaches them through Distributors, OEMs, and End Users. Three audiences with three different experiences of the same company.
Roll them into one average, and the number tells you nothing. Everyone looks fine, and no one knows what to fix.
There is a second problem that most CX programs never solve. A single survey gives you a score with no context. Is 87 good? Better than last year? Better on the dimensions that matter, or just better on the easy ones? Without consistent measurement over time, you cannot tell improvement from noise, and you cannot prove that anything you did actually worked.
The Approach: Consistent Measurement, Year After Year
Yaskawa runs two feedback programs with us, and they do different jobs.
The Daily Feedback Program captures sentiment right after operational touchpoints, while the interaction is still fresh. It surfaces problems at the level of a specific order, support call, or account.
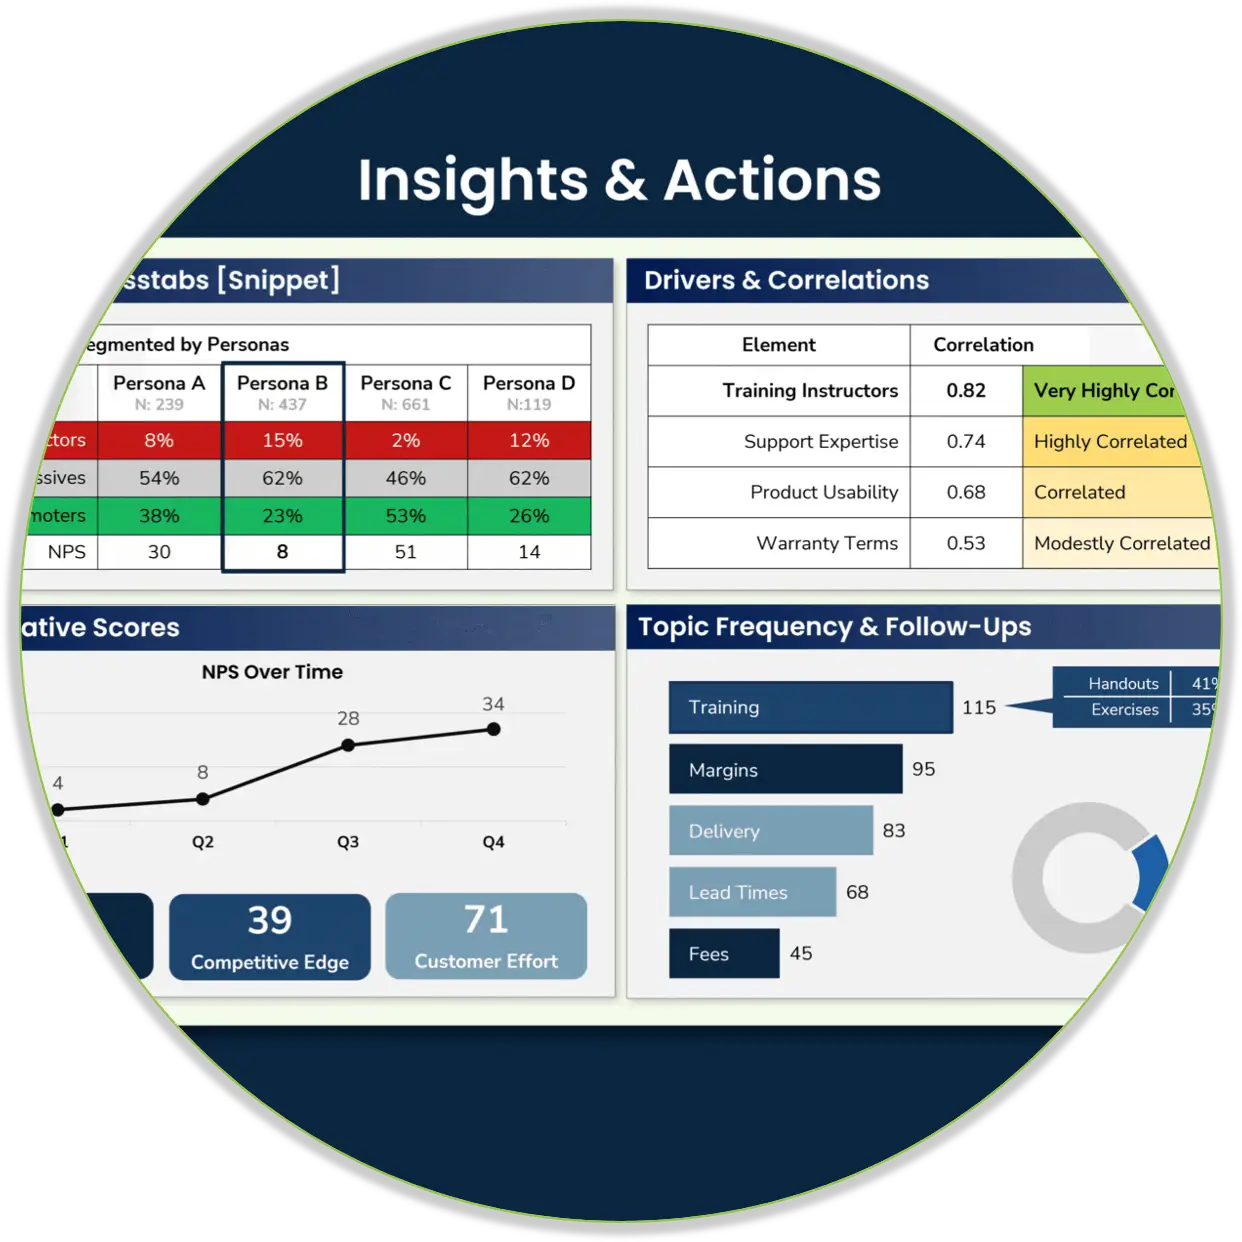
The Annual Audit is the benchmark read. Every year, we field the same study to a designed sample of the customer base as a third party and score 112 dimensions against the prior year and external benchmarks. Same method, same rigor, every cycle. That consistency is what makes the trend line real.
Both run on our TrueData™ model. Questions are written to strip out bias because leading language and agreement-seeking phrasing inflate scores and produce faulty data. Then correlation analysis sorts the results, separating the dimensions that move satisfaction from the ones that don’t.
The close work happens between cycles. We do not hand over a report and leave. Each year’s findings become the next year’s priorities, and the daily program tracks whether the fixes are landing before the next audit confirms it.
The Findings
In 2025, overall satisfaction reached 90 out of 100, nine points above the ACSI® Durable Goods benchmark of 81. That gap is the number Yaskawa monitors and is an outstanding score. In addition, Net Promoter Score reached 66, up more than four points from the prior year. In B2B, an NPS above 50 is a strong result. One that keeps climbing the ladder is even better!
The 2025 audit also mapped where experience varied by segment. Not a general call to improve service, but which group felt which gap at which touchpoint. Yaskawa is working on that roadmap through 2026. One of their credos is ‘never-ending improvement.’
Why Using a Third-Party Matters
Customers notice who is doing the asking.
“The fact that Yaskawa has invested in finding out how to help their customers speaks volumes about the company and the direction in which they are heading.” Large distributor, Northeast
Most companies underestimate that reaction. Sending your own survey signals that you want a score. Commissioning an independent audit signals that you want the truth, including the parts that sting. Distributors read the difference immediately, and it changes what they tell you.
Worth being precise about what independence means here. We know Yaskawa’s business well, and we work alongside their team. Independence is not distance. It is a method: we write the questions, we collect the data, and we report what comes back. The relationship is close. The instrument is clean.
The Announcement
Yaskawa’s 2025 results were announced in April 2026. The full release carries the complete findings and commentary from both companies.
Takeaways for B2B Leaders
Measure the same way (or at least similarly) every year. One survey gives you a number. A consistent longitudinal study gives you a direction, and direction is what you can act on.
Measure at the dimension level. A composite score tells you how you’re doing. It never tells you what to do. The decision lives one layer down.
Find the correlations before you spend. Improving a dimension nobody weighs heavily is expensive and invisible.
Run both clocks. Continuous feedback catches this week’s problem. An annual third-party audit tells you whether the pattern is improving.
Interaction Metrics has conducted this study as an independent third party since 2014. Survey design, sampling, deployment, analysis, and reporting are handled in-house, with software included.
Let’s Build the Right Survey for You!
Stop settling for surveys that fall short. Let’s build a survey that gives you honest answers, drives action, and accelerates growth.


"*" indicates required fields
More TrueData™ Successes
Case: Southwest Engineering Manufacturer
KPI: Churn rate.
The Situation: Our client, a Midwest engineering manufacturer, was losing customers and finding out too late to save them. Churn was the visible metric. What the company didn’t have was an early warning system feeding it.
Our TrueData™ Approach: We built semi-annual TrueData™ surveys, designed to surface specific dissatisfaction patterns rather than overall sentiment scores. We added questions about competitors and the wider market. Plus, we supplemented the semi-annual program with daily quick surveys at key touchpoints.
The Result: Account teams now see warning signs months ahead of the renewal cycle. That window is long enough to intervene in individual relationships before customers have quietly decided to look elsewhere. Churn rate dropped by 12%.
Case: Northeast Automation Manufacturer
KPI: Revenue from existing accounts.
The Situation: Our client, a Northeast automation manufacturer, was running Net Promoter surveys and getting feedback, but not insight. The results kept confirming either nothing or what leadership already thought they knew.
Most importantly, none of the questions revealed which products customers wanted or how they wanted to buy. Revenue from existing accounts had plateaued, and none of the execs could say why.
Our TrueData™ Approach: We completely redesigned the survey and launched it as an annual TrueData™ program – with quarterly check-ins. Now we regularly surface unmet product needs and buyers’ preferences, which in turn unlock larger orders.
The Result: Accounts that the sales team had written off as fully tapped became a new source of revenue. Our surveys continually reveal which products customers want in larger quantities. The team has built outreach around those specific gaps. Revenue per existing account has grown by 6% year over year.
Case: Pacific Northwest Tool Supply Distributor
KPI: Customer advocacy.
The Situation: Our client, a Pacific Northwest tool supply distributor, was running templated post-interaction surveys that went out after each customer service interaction. The result was inflated five-star scores and no useful information about what to change. Customer advocacy looked strong on paper. The data was too smooth to be real.
Our TrueData™ Approach: Our TrueData™ surveys surfaced specific nuances in interactions and a running list of (mostly small) changes customers wanted. The result was an honest data feed, not inflated satisfaction averages.
The Result: This time, the scores meant something. And so targeted operational changes drove an 8% lift in customer referrals within enterprise corporations.
If churn, revenue, or advocacy matter this year, let’s talk.
Here’s Why Our Programs Work
We start with the KPI. What does your business need to change? What data would prove it changed? Many surveys skip that step.
We design for specifics, not averages. Five-star scores are easy to give and hard to use. What moves a business is naming a competitor a customer, or surfacing a product that customers wish you sold.
We run programs over quarters and years, not weeks. Real KPIs tend to move slowly. For example, you probably won’t fix churn in a quarter. Retention is a long-term business outcome, so the data has to keep coming in for the picture to hold.
Most of our clients work in tight markets, where competitive intelligence matters. Our contracts include a clause that keeps us from working with your three to five closest competitors during the engagement. It’s exclusivity you can count on.
The same multi-year structure is what gives you longitudinal data: the same customer base, measured with the same methodology, year after year. It’s how you can tell you are looking at an actual shift in perception, not just quarterly noise.
We’d love to talk about what longitudinal data can do for you.

A good customer survey isn’t one click. It’s dozens of steps.
We handle them all.
Let’s streamline your survey and give you data you can trust.
Built-In Features that Drive Growth

Software included.
No add-on costs. No upsells. No separate licenses. Just results.

Custom design. Bias-free.
Built from scratch to match your goals—no templates, no leading questions, no fluff.

Thematic insights.
Evidence based, statistically valid data presented in priority order.

Human-coded text analysis + AI.
Every open-ended response coded for nuance and clarity.

Highest response rates!
100% deliverability. 100% engaging. Surveys customers want to take.

CEO-ready Findings Reports.
Action-focused presentations designed for executives and frontline teams.
Trusted by Companies Like Yours

The AI Survey Trap
AI builds surveys from templates, not experience. At Interaction Metrics, we use AI where it adds value and lose it where it doesn’t. Our analysts supply the oversight, alignment, and objectivity that AI can’t.
Built for B2B teams that need survey experts, not another DIY tool.
Only Need Software
Level 1
If you already have your survey designed, power it up with the best software and the experts who know how to use it.
$1500-$3000
Complete Design & Deploy
Level 2
All your survey questions, logic flow, rating scales, email campaign, and every other step are managed for you.
$6000-$9900
Get The Analysis Too
Level 3
Crosstabs, correlations, text analysis, dashboards, and findings decks with next-step actions presented to your team.
Varies by Complexity
Need Something More Tailored?
Not every challenge fits neatly into a package. We build custom research and survey strategies for teams with unique goals, complex audiences, or multi-phase initiatives.
Frequently Asked Questions
Bring it. We often start by analyzing what you have. Sometimes the audit alone changes how you think about the next survey.
No. We work inside whatever professional platform you already use. If you don’t have one, we’ll deploy on the software platform that fits. We have plenty of software licenses. The methodology matters more than the tool.
Less than you’d expect. We handle the design, the deployment, the outreach, the analysis. Your team’s job is to tell us what decisions the data needs to inform, and then act on what we find.
First findings come back in weeks. Real KPI movement takes longer. Churn rates and advocacy scores don’t shift on a quarterly cycle, which is why our programs run for years. If you just need a one-time read, we can do that. It’s a different project.
Yes. Book a TrueData™ Demo and we’ll walk through anonymized examples from real engagements. The demo is also where we figure out if we’re the right fit. It goes both ways.
More Resources:

Rules for Writing B2B Customer Satisfaction Survey Questions
Last Updated: February 10, 2026 Effective B2B customer satisfaction surveys are designed to produce decisions, not just data. To move beyond generic ratings, B2B firms must use role-based routing, suppression strategies, and expectation-gap mapping. This guide outlines the essential rules for transforming B2B surveys into strategic assets that protect revenue and improve customer retention. The […]

The Cost of Customer Satisfaction: Survey Program Costs
Last Updated: February 24, 2025 What are typical customer survey program costs? Clients ask this all the time, and the answer varies widely. A simple, off-the-shelf survey might cost very little, while a comprehensive, data-driven program requires a bigger investment. If you’re considering options, surveys can range from quick satisfaction checks to full-scale programs. […]

5 Ways B2B CX Stands Apart
In 90 seconds, Kaitlyn Bartley explains 5 ways B2B CX is different. McKinsey & Company reports that B2B companies score substantially lower on customer satisfaction than consumer companies. One reason B2B companies underperform on customer satisfaction is they are more complicated — with more moving parts — than retailers. But another reason is that without […]

22 Best Practices for Surveys: Tips for Writing, Design, and Analysis
You’ve probably been on the receiving end of a bad survey. Maybe it asked you to rate a delivery you never received. Or it forced you to choose between three irrelevant response options, none of which applied to you. Or perhaps you actually took the time to explain a problem in your own words, and […]