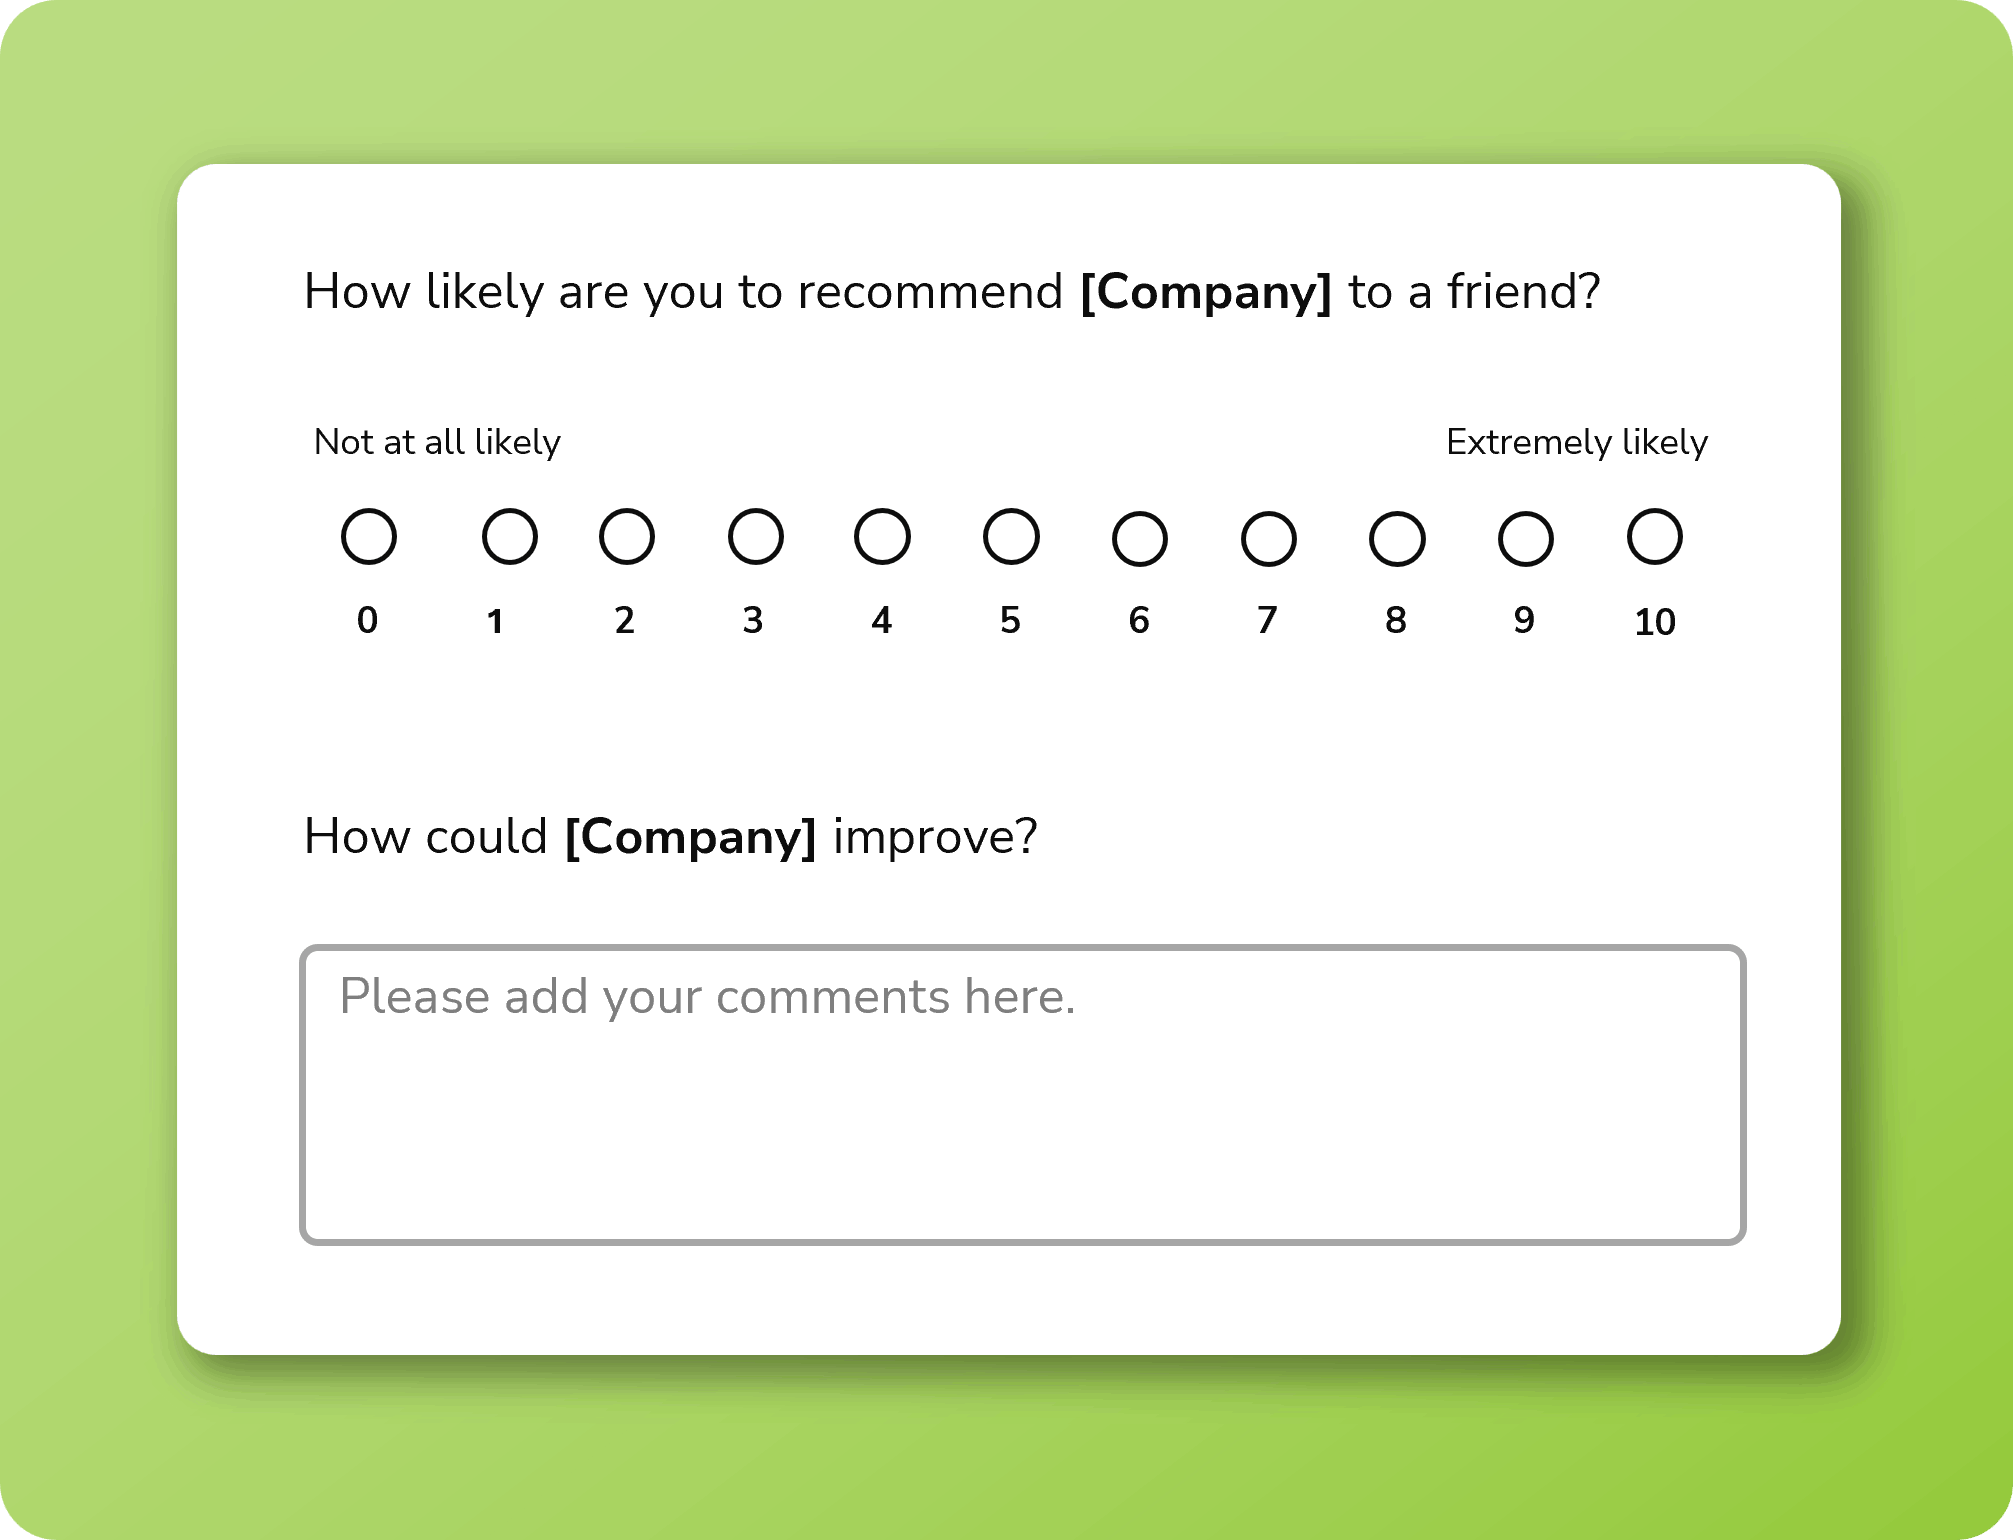
Net Promoter Score (NPS) is a specialized customer loyalty metric that measures the likelihood of a customer recommending a brand to a friend or colleague on a scale of 0 to 10.
66% of companies: This is the proportion of Fortune 1000 companies that rely on Net Promoter Score to benchmark their performance and improve the customer experience, at least as of 2020.
Bain & Company created the Net Promoter Score (NPS). NPS pioneers Fred Reichheld and Rob Markey established this methodology to provide a clear, predictive alternative to traditional, complex customer satisfaction surveys. Since its inception, the Net Promoter Score has evolved into the primary metric that guides corporate strategy and investment for the world’s most successful organizations.
Interaction Metrics provides independent surveys and strategy to eliminate internal bias and deliver TrueData™. Talk to us about your survey.
A reliable NPS program depends on measurable discipline, not only a single score. SurveyMonkey reports an average NPS of 32 and a top-quartile benchmark of 72 or higher across its benchmark dataset.
Net Promoter Score Strategy
A good NPS depends on context, because NPS benchmarks vary dramatically by industry average and by customer expectations. A strong NPS program protects comparability over time, because a tracking study requires consistent sampling, consistent timing, and consistent survey wording.
For senior leaders, an objective NPS program offers a critical value proposition: it provides a high-integrity revenue predictor that eliminates the “politeness bias” inherent in internal surveys.
By utilizing an independent third-party to manage your survey design and evidence-based analysis, you ensure that every data point is a scientifically valid reflection of your market standing, enabling leaders to act on clearer analytics without the risk of skewed results from internal incentives.
Key Takeaways for Senior Leadership
| Contextual Benchmarking | A “good” score is relative; while the cross-industry average is 32, top-quartile leaders consistently target 72 or higher. |
| Methodological Discipline | Reliable NPS tracking requires consistent sampling and wording to protect the integrity of past performance comparisons. |
| Third-Party Rigor | Independent administration reduces respondent bias and increases the honesty of survey responses. |
| Actionable Intelligence | Dashboards must translate raw open ended feedback into strategic mandates to move from “score watching” to “experience improvement”. |
What is a Good NPS?
A good NPS is a score that is both strong relative to a specific industry average and consistently improving against a company’s past performance benchmarks.
SurveyMonkey reports an average NPS of 32 and a top-quartile NPS of 72 or higher, which makes 32 a useful reference point for NPS benchmarks.
A “good net promoter score” decision should always reference comparable customers, because customer base differences change the meaning of the score. A B2B manufacturer can see lower scores than a consumer brand and still retain loyal customers, because referral behavior differs across markets.
NPS should also be interpreted with survey responses that explain drivers. A higher score without clear customer feedback can still hide pain points that later produce lower scores.

What Bad Surveys Cost You
Bad surveys lose customers. Learn 5 mistakes and how to fix them.
Who Uses Net Promoter Score and Why Does It Matter?
Senior leaders prioritize Net Promoter Score because the metric is exceptionally easy to communicate and track across global business units. Customer experience leaders utilize NPS data gathered through consistent methodology to reveal the trend direction of brand health over time.
When net promoter score is paired with sophisticated open ended feedback analysis, it turns a simple number into a high-definition operational plan by revealing exactly why customers feel the way they do.
Who Does Net Promoter Score Surveys?
NPS surveys are typically administered by internal teams, basic survey platforms, or independent third-party research partners specializing in scientific survey design. A third-party approach is most valuable when a company needs objective measurement, consistent methodology, and survey respondents who feel safe providing honest feedback.
While internal teams often have strong context on the customer journey, they also carry internal incentives that can unintentionally influence survey wording and sampling. A third-party partner standardizes NPS score calculation and preserves the same formula across years, which is essential for any high-integrity tracking study.
Customer Loyalty is the Goal, so What Does an NPS Score Actually Measure?
NPS measures customer loyalty through recommendation likelihood, because the net promoter question asks about recommending to a friend or colleague.
Customer loyalty is not the same as customer satisfaction, because customer satisfaction can be high after a support call even when brand experience trust is low. Customer loyalty can also remain strong in complex B2B relationships even when customers report poor experiences in one department.
An NPS program should treat customer loyalty as a strategic outcome that reflects the overall brand experience. A reliable program also treats NPS as a system, because the net promoter system depends on survey governance, feedback loops, and action planning.
How Do You Calculate Net Promoter Score?
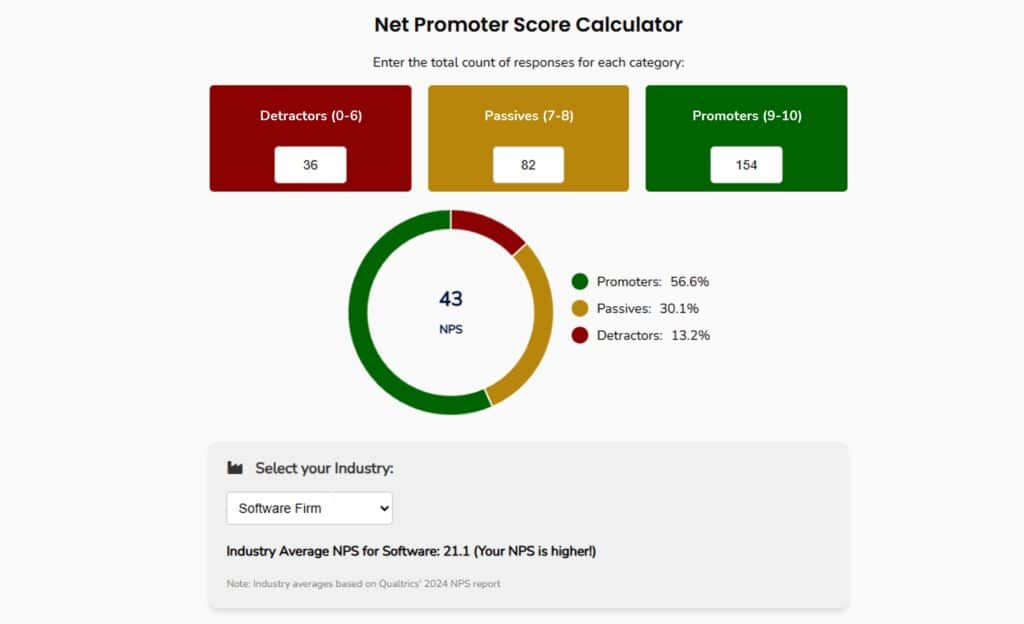
You calculate Net Promoter Score by subtracting the percentage of detractors from the percentage of promoters, a process that results in a final score between -100 and +100.
A correct calculate NPS process begins with clean survey responses and clear categorization of responses. Responses of 9–10 are considered promoters, responses of 7–8 are passives, and responses of 0–6 are detractors in the classic NPS scale definition.

An NPS score calculation should be replicated exactly across time to support past performance comparisons. A tracking study should never change the NPS question wording, because even small wording changes can cause lower scores or higher score shifts that reflect measurement artifacts.
| Category | Rating | Definition |
|---|---|---|
| Promoters | 9 – 10 | Loyal enthusiasts who drive growth through active referrals. |
| Passives | 7 – 8 | Satisfied but unenthusiastic customers vulnerable to competitive offers. |
| Detractors | 0 – 6 | Unhappy customers who can damage a brand via negative word of mouth. |
What is the Fastest Way to Calculate Your NPS Without Compromising Accuracy?
You can calculate your NPS and compare to industry benchmarks with our NPS calculator, but validate inputs before reporting the overall NPS score. An NPS calculator should only be trusted when the survey respondents are defined, response categories are consistent, and sample exclusions are documented.
Fast calculation does not replace sound methodology. A net promoter score calculation can be precise and still be misleading when survey respondents are biased toward happy customers or toward unhappy customers.
A third-party research partner can calculate your NPS while also auditing methodology. A third-party partner can also produce an executive-ready narrative that explains what moved and why the movement matters.
What is a Good NPS and What is an Average NPS?
A good NPS is a score that exceeds your industry’s median benchmark while demonstrating a statistically significant upward trend compared to your organization’s past performance.
A single average score should never be treated as a universal target, because scores vary dramatically across industries and business models. A SaaS product with frequent interaction can generate different patterns than a capital equipment provider with long cycles.
Executives should define “good net promoter score” using a peer set and a time series. A good NPS interpretation also requires that customers are surveyed under consistent conditions.
How Should an NPS Program Think About Overall Customer Satisfaction?
Customer satisfaction (CSAT) is a measure of how satisfied customers are with an experience, while net promoter score is a measure of recommendation likelihood. Overall customer satisfaction can correlate with higher NPS, but overall customer satisfaction can also mask risk when customers remain polite but disengaged.
Customer satisfaction can be the right metric for touchpoints, because a support call or onboarding event can be rated immediately. Net promoter score should usually reflect a broader brand experience, because a recommendation is rarely based on one service moment.
A mature program uses both measures with clear roles. A mature program also keeps customer satisfaction wording neutral to reduce bias in survey responses.
How Does Customer Experience Affect NPS, and Why Does the Customer Journey Matter?
Customer experience shapes NPS because it sets expectations and determines whether customers feel confident recommending a company. Customer journey design matters because recommendation intent often reflects a sequence of moments, not a single transaction.
Customer journey analysis becomes more actionable when NPS data is segmented by lifecycle stage. Segmenting by onboarding, delivery, renewal, and service can identify areas that produce unhappy customers.
A third-party program can map NPS survey results to customer journey stages consistently. Consistent mapping helps leaders identify which moments contribute to negative word of mouth and which moments create loyal enthusiasts.

How Do You Gather Feedback in a Way that Customers Will Answer Honestly?
Gather feedback by making the survey easy, neutral, and safe for survey respondents. Survey respondents are more candid when anonymity or confidentiality is credible, because credibility reduces fear of consequences.
Survey design should reduce leading language and reduce internal signaling. A third-party program increases perceived independence, and independence increases the probability that customers feel comfortable sharing open ended feedback.
At Interaction Metrics, we design feedback programs that combat survey fatigue. Tell us about your survey.
This specialized approach ensures that every actionable insight presented to leadership is backed by proprietary rigor and a truly objective view of the brand experience.
Should NPS be Anonymous?
NPS anonymity is a survey design protocol that protects the identity of respondents to encourage the disclosure of unfiltered, honest feedback. NPS should be anonymous when customer relationships involve power dynamics, because anonymity reduces pressure and increases honesty in responses.
NPS can be non-anonymous when a company has a clearly defined closed-loop process and trust is already high.
Research conducted by Interaction Metrics reveals that customers are significantly more candid when their identities are shielded from the company they are evaluating. In one specific case study for a B2B client, the organization saw a 15-point difference in NPS when they moved from a non-anonymous survey to an anonymous third-party methodology.
The transition to an anonymous format in that case study resulted in the Net Promoter Score dropping from a “polite” +4 to a “truthful” -11. Respondents who specifically opted for anonymity produced an NPS of -22, a figure that uncovered critical operational defects previously hidden by respondent fear.
Response rates increased by 5% during this shift, as customers were more willing to participate when they were guaranteed that their specific comments would not result in sales follow-ups or awkward account management calls.
A third-party administrator provides the necessary layer of credible anonymity that internal teams can’t offer, which is essential for any leader seeking a truly objective and scientific view of their customer loyalty.
What are NPS Survey Best Practices for a Tracking Study?
NPS survey best practices for tracking require consistent sampling, consistent timing, and consistent wording. A tracking study should preserve the same formula and the same NPS scale, because comparability creates meaningful trend interpretation.
Best practices also require stable definitions for customer segments. Stable definitions ensure that “customer base” changes are recognized rather than hidden inside an overall NPS score.
Best practices include a plan for open ended feedback analysis. Open ended feedback analysis is often where the most valuable drivers and pain points appear.
What Are the Benefits of Net Promoter Score, and What Are the Disadvantages of Net Promoter Score?
The benefits of net promoter score include simplicity, comparability, and executive clarity, because the score communicates direction quickly. The disadvantages of net promoter score include oversimplification and the risk of gaming, because teams can chase higher score outcomes rather than fix drivers.
A net promoter score can become a vanity metric when incentives are attached to the number. A net promoter score can also mislead when survey responses represent only happy customers who are willing to answer.
| Feature | Strategic Benefit | Potential Disadvantage |
|---|---|---|
| Simplicity | Easy to communicate and understand across all levels of the company. | Can lead to a shallow understanding of complex customer issues. |
| Comparability | Allows for benchmarking against a global industry average. | Benchmarks vary dramatically, making raw scores misleading without context. |
| Predictability | High-integrity scores correlate strongly with long-term revenue growth. | Biased or “self-graded” surveys produce false signals that hide churn risk. |
A third-party program reduces these risks by enforcing neutral measurement and by emphasizing drivers. Driver analysis makes NPS a tool for customer experience improvement rather than a scoreboard.
How Do You Improve NPS Score Without Gaming the Score?
To improve NPS score, improve the experiences that create promoters and by eliminate the drivers that create detractors. A higher NPS is earned by addressing pain points that customers mention repeatedly in customer feedback, not by changing the NPS question.
A reliable improvement plan starts with theme analysis of open ended feedback. A reliable improvement plan then links themes to segments, because different customer groups can produce lower scores for different reasons.
A third-party partner can quantify themes and relate themes to outcomes using humans + AI. Human judgment ensures interpretability, and AI accelerates pattern detection across responses.
What Should an NPS Dashboard Include?
An NPS dashboard should show trends over time, segment filters, and theme drivers from open ended feedback. An NPS dashboard should also show promoter, passive, and detractor distributions, because the overall NPS score can hide changes in the three groups.
A useful dashboard supports decision-making in minutes. A useful dashboard turns NPS data into “what changed, where it changed, and why it changed.”
| Dashboard Element | What Leaders Learn | Why the Element Matters |
|---|---|---|
| Overall NPS Score Trend | The direction of customer loyalty over time. | Trend context prevents overreacting to one period and establishes past performance benchmarks. |
| Three Groups Distribution | The specific share of promoters, passives, and detractors. | Movement inside the score explains what changed, even when the overall NPS score remains flat. |
| Segment Filters | Performance differences by customer type, region, product, or lifecycle stage. | Segments help identify areas to prioritize for maximum impact on customer relationships. |
| Theme Driver View | Top pain points and delight drivers extracted from customer feedback. | Drivers convert open ended feedback into actionable insights for operational change. |
| Closed-Loop Tracker | Follow-up actions and resolution patterns for specific detractors. | Resolution supports customer retention and significantly reduces churn risk. |
A dashboard should be designed for senior leader comprehension. A dashboard should avoid analytic clutter and emphasize clarity, because clarity leads to action.
How Do NPS Benchmarks and Industry Average Benchmarks Vary, and Why Do Benchmarks Vary Dramatically?
NPS benchmarks are standardized reference points used to compare a company’s Net Promoter Score against the performance of competitors or the broader industry.
NPS benchmarks vary because industries differ in customer expectations and recommendation behavior. SurveyMonkey’s global benchmark shows an average NPS of 32, but an industry average can differ significantly by sector.
NPS benchmarks vary significantly between industries because of differences in customer expectations, competitive intensity, and the emotional nature of the service provided.
In a 2025 report, consumer-facing (B2C) companies achieved a median NPS of 49, whereas business-focused (B2B) firms trailed with a median of 38. This 11-point Net Promoter Score gap between B2B and B2C sectors reflects the unique challenges of B2B relationships, where professional buyers demand complex integrations and high-stakes support that are more difficult to deliver consistently than the streamlined experiences often found in retail.
NPS benchmarks should be treated as directional context rather than a universal rubric. A leader should rely on peer benchmarks and internal trend lines to set performance targets.
How Does NPS Compare to CSAT and CES, and When Should Leaders Use NPS Alternatives?
NPS alternatives are complementary customer metrics such as Customer Satisfaction (CSAT) and Customer Effort Score (CES) used to diagnose specific operational touchpoints rather than overall relationship health.
While Net Promoter Score predicts long-term growth and advocacy, metrics like CSAT and CES provide the granular, transactional data needed to optimize individual service events like a support call or a website checkout.

NPS vs CSAT is a comparison between loyalty intent and satisfaction with a specific experience, and customer effort score vs NPS is a comparison between friction and advocacy. NPS alternatives such as CSAT and CES can be better for diagnosing a specific touchpoint when the goal is to reduce effort and improve service.
For example, a customer may report a high CSAT score for a recent interaction but remain a detractor on the NPS scale due to cumulative brand experience issues. Interaction Metrics provides the objective and scientific view required to deploy the right metric for the correct diagnostic goal, ensuring that leaders receive clear analytics that differentiate between immediate happiness and long-term loyalty.
A combined measurement system prevents false conclusions. A combined measurement system also prevents teams from using NPS where NPS is not well suited, such as after a single support call.
| Metric | Best Use | Typical Question Focus |
|---|---|---|
| Net Promoter Score (NPS) | Relationship health and recommendation intent. | Likelihood to recommend to a friend or colleague. |
| Customer Satisfaction (CSAT) | Immediate satisfaction with a specific touchpoint. | Satisfaction with a recent interaction. |
| Customer Effort Score (CES) | Measuring friction and ease of accomplishing a task. | Ease of resolving an issue or completing an action. |
An NPS strategy should use the right tool for the diagnostic goal. A leader should not force a loyalty metric onto a transactional measurement problem.
How Do You Turn Survey Responses Into Actionable Insights That Leaders Can Understand?
Actionable insights require that survey responses are translated into clear themes and clear priorities. Leaders act faster when the analysis shows which issues create detractors, which improvements create more promoters, and which segments are at risk.
Interaction Metrics uses evidence-based insights supported by humans + AI. Human analysts interpret nuance in customer feedback, and AI accelerates pattern discovery across responses.
A strong analysis also uses numbers in everything, because quantified drivers support confident decisions. A quantified driver model helps senior leaders allocate resources without debating anecdotes.
| Data Stage | Executive Output | Strategic Value for Leadership |
| Raw Responses | Unstructured customer comments and ratings. | Provides the “voice of the customer” in its most authentic form. |
| Topic Intensity™ | Categorized feedback grouped by themes. | Identifies which specific departments or processes are creating detractors. |
| Actionable Insights | Quantified priorities with clear ROI implications. | Translates complex data into a direct mandate for executive action. |
Topic Intensity™ is a proprietary text analytics metric that measures the density and priority of specific themes within customer feedback.
Why Should a Company Hire an External Party for an NPS program?
A company should hire an external party when objectivity, credibility, and consistency matter more than convenience. An external party reduces bias by separating measurement from internal incentives, and an external party increases honesty by making independence visible to customers.
A third-party program also improves methodology and can preserve a tracking-study design that protects comparability across time.
An external partner can also deliver clear analytics that leaders understand. Clear analytics help teams move from “score watching” to “experience improvement.”
What Does NPS Consulting Actually Include, and What Should a Leader Expect From an NPS Consulting Partner?
NPS consulting is a specialized advisory service that provides the scientific methodology, neutral administration, and advanced analytics required to transform a raw Net Promoter Score into a strategic driver of company growth.
For senior leaders with spending power, an expert partner provides a vital layer of objectivity, ensuring data integrity and eliminating the “self-grading” bias often found in internal survey programs.
NPS consulting should include survey design, neutral administration, statistical hygiene, and analysis that integrates customer feedback with segment performance. NPS consulting should also include dashboard design and action planning, because an NPS program fails when results are not operationalized.

A credible partner should be explicit about sampling and response handling. A credible partner should also document how they will handle low response rates, because low response can distort NPS data.
An Interaction Metrics NPS program combines rigorous survey methodology with executive-ready storytelling. We provide analytics that leaders can use without translation, because senior leaders need clarity rather than jargon.
How Should You Choose an NPS Survey Company?
Choose an NPS survey company by evaluating independence, methodology, and the ability to convert feedback into decisions. A strong NPS survey company can explain how the company will gather feedback, how the company will calculate net promoter score, and how the company will connect drivers to actions.
A leader should look for evidence of tracking-study discipline. A leader should also look for evidence that the firm can interpret open ended feedback, because open ended feedback often contains the real drivers behind promoters and detractors.
How Do You Start an NPS Program That Leaders Will Trust?
Start an NPS program by defining objectives, defining segments, and defining a consistent cadence for measurement. A trustable program includes an upfront plan for how leaders will use results, because a survey program without follow-through teaches customers that feedback vanishes.
A strong program also defines how the program will respond to detractors. A strong program includes a closed-loop process that reduces churn risk and improves customer retention.
A third-party partner can design these systems with neutrality. Neutrality supports honest responses and reliable trend measurement, which supports long-term customer relationships.
What Is the Simplest Next Step if Your Organization Wants Objective NPS Measurement?
A baseline NPS audit is a preliminary, third-party assessment used to establish a scientifically valid reference point for an organization’s customer loyalty and brand experience.
The simplest next step is to run a baseline NPS survey with a third-party methodology and a leader-ready dashboard. A baseline provides a credible starting point for improvement because a baseline establishes a clean reference for past performance comparisons.
Interaction Metrics measures customer satisfaction, analyzes feedback, and uncovers what your survey responses mean. Tell us about your survey goals.
If you are ready to transform your NPS from a simple number into a strategic growth engine, the most effective first step is to engage an expert firm that understands how to turn raw survey responses into actionable insights that leaders can understand.