TrueData™ SURVEYS
B2B Customer Satisfaction Metrics that Reveal the ‘Why’
We isolate what’s driving satisfaction, so you can fix what’s broken and amplify what’s working.


B2B Survey Experts + Third-Party Objectivity + Software Included
We bring certified analysts (CCXP) and proven methods. And, you’ll have no licensing costs, no learning curve.
Satisfaction Metrics by Drivers, Segments & QCI™
A satisfaction score tells you whether you’re meeting expectations. It doesn’t tell you why, or where to act. So we break every result down by driver and segment, like product line, customer type, or region. You see how your NPS or CX Score moves across each group instead of one company-wide average that hides the real story.
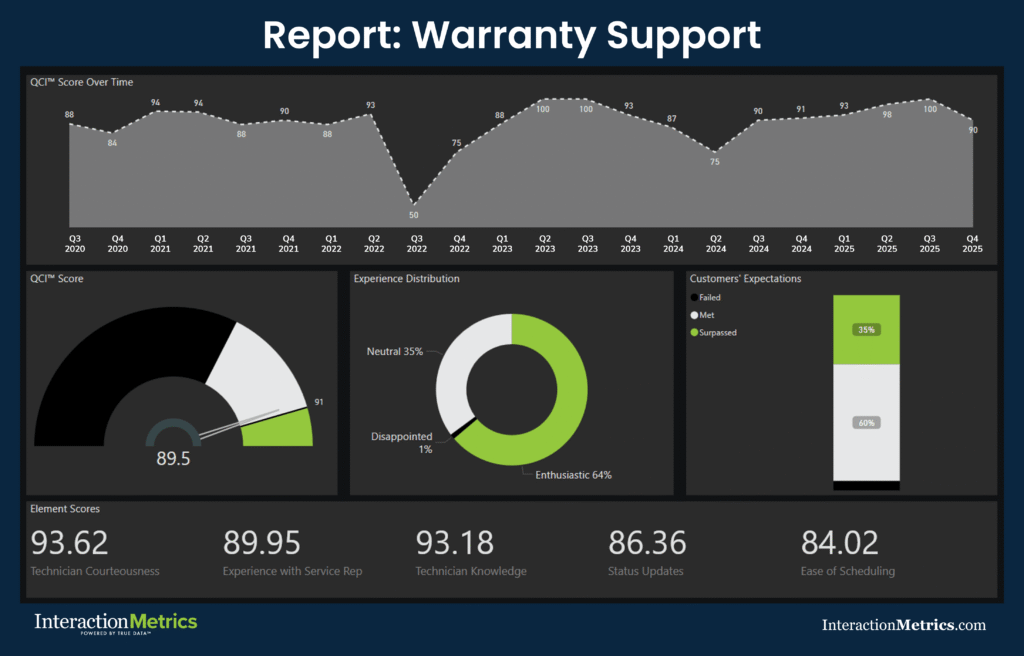
Then we go past the single number with our Quality of Customer Interaction (QCI™) Score. A standard score tracks one figure over time. QCI™ weights that figure by what actually mattered to each customer in each situation. Some factors carry far more weight than others, and the mix shifts from one account to the next. QCI™ captures that and hands you a ranked list of which fixes will raise satisfaction fastest.
Let’s Build the Right Survey for You!
Stop settling for surveys that fall short. Let’s build a survey that gives you honest answers, drives action, and accelerates growth.


"*" indicates required fields

Text Insights That Explain the Numbers
A score is a snapshot. Text analysis tells you what’s inside it. We read every comment, strip out the bias, and pull the themes and sentiment that keep surfacing. Now the number carries its reason with it.
That’s how you learn what your accounts are really saying. We map each verbatim to the touchpoint it came from, so you can see which parts of the experience move satisfaction, whether that’s a service call or the product itself.
TrueData™ Surveys are for B2B Companies
with High-Value Customer Relationships


A good customer survey isn’t one click. It’s dozens of steps.
We handle them all.
Let’s streamline your survey and give you data you can trust.
Built-In Features that Drive Growth

Software included.
No add-on costs. No upsells. No separate licenses. Just results.

Custom design. Bias-free.
Built from scratch to match your goals—no templates, no leading questions, no fluff.

Thematic insights.
Evidence based, statistically valid data presented in priority order.

Human-coded text analysis + AI.
Every open-ended response coded for nuance and clarity.

Highest response rates!
100% deliverability. 100% engaging. Surveys customers want to take.

CEO-ready Findings Reports.
Action-focused presentations designed for executives and frontline teams.
Trusted by Companies Like Yours

The AI Survey Trap
AI builds surveys from templates, not experience. At Interaction Metrics, we use AI where it adds value and lose it where it doesn’t. Our analysts supply the oversight, alignment, and objectivity that AI can’t.
Built for B2B teams that need survey experts, not another DIY tool.
Only Need Software
Level 1
If you already have your survey designed, power it up with the best software and the experts who know how to use it.
$1500-$3000
Complete Design & Deploy
Level 2
All your survey questions, logic flow, rating scales, email campaign, and every other step are managed for you.
$6000-$9900
Get The Analysis Too
Level 3
Crosstabs, correlations, text analysis, dashboards, and findings decks with next-step actions presented to your team.
Varies by Complexity
Need Something More Tailored?
Not every challenge fits neatly into a package. We build custom research and survey strategies for teams with unique goals, complex audiences, or multi-phase initiatives.
What Are Customer Satisfaction Metrics?
Customer satisfaction metrics track how well your company meets or exceeds customer expectations. But most survey platforms stop at a basic score—leaving you with numbers, not answers.
At Interaction Metrics, we go further. We combine satisfaction data with customer sentiment, comments, and strategic analysis to uncover the “why” behind your results. It’s a smarter way of measuring customer satisfaction—because numbers without meaning are just noise.
Why Satisfaction Metrics Matter for CX Strategy
As expectations rise, customer satisfaction becomes a leading indicator of retention, loyalty, and even referrals. Bain & Company highlights how structured Customer Satisfaction Systems do more than generate scores—they link changes in retention and loyalty directly to revenue and profit growth. This reinforces that satisfaction metrics must evolve into systems for lasting business impact Bain.
Satisfied customers return more often, share positive reviews, and engage with your team more constructively. But relying on a single customer satisfaction score doesn’t tell you enough. You need metrics that reflect the full customer journey—and that’s where our customer survey services come in.
Interaction Metrics is a customer survey company that turns feedback into strategy. Our approach helps you pinpoint what’s working, what’s broken, and where satisfaction differs across segments, regions, and products. With the right satisfaction metrics in place, you’ll have the confidence to take action.
CSAT: Customer Satisfaction Score
Customer Satisfaction Score (CSAT) is one of the most commonly used metrics. It asks customers how satisfied they were with a specific interaction, such as a recent support call or product delivery. But while the CSAT metric is popular, it’s often shallow. That’s why we use advanced methods to correlate satisfaction with open-ended feedback, sentiment trends, and behavioral data. It’s not just about the number—it’s about the story behind the score.
Our analysts look at CSAT data across departments and customer types. Whether you’re focused on service recovery or product reliability, we make the data actionable.
NPS: Net Promoter Score
Net Promoter Score (NPS) is another widely used satisfaction metric. It measures loyalty by asking how likely a customer is to recommend your company. While powerful in theory, NPS can be misleading if it’s not analyzed correctly. We evaluate your net promoter score NPS trends across time, mapping promoter and detractor groups to pain points and touchpoints in the customer journey. This way, you don’t just see who likes you—you see why.
Unlike platforms that simply deliver a score, we turn NPS into a true loyalty diagnostic tool. This helps you reduce customer churn, spot dissatisfaction early, and understand what drives long-term loyalty.
CES: Customer Effort Score
Customer Effort Score (CES) captures how easy it is for customers to complete a task—like getting a quote or resolving an issue. Often, customers won’t mention friction directly. But when we analyze customer effort score CES data, we can detect where support processes, website tools, or product instructions are creating extra work.
Effort is one of the best predictors of future loyalty. That’s why we include CES in your broader customer experience metrics framework. It connects usability to satisfaction—and helps identify invisible barriers that cost you business.
Going Beyond the Big Three
While CSAT, NPS, and CES are essential, they aren’t enough on their own. Depending on your business goals, we might also analyze customer churn rate, customer health score, or customer retention rate.
These metrics measure how satisfaction translates into actual behavior. For example, high satisfaction might not result in loyalty if product value or price alignment is lacking.
We also consider customer lifetime and customer loyalty metrics, giving you a holistic view of experience over time. Tracking these in tandem with customer satisfaction feedback creates a more accurate picture of how your customers feel—and what they’re likely to do next.
How Many Responses Do You Actually Need?
Before you dive into satisfaction metrics, it’s essential to know if your sample size is statistically valid. Too few responses, and your metrics might mislead. Too many, and you’ll waste resources.
What Drives Customer Satisfaction?
Satisfaction isn’t just about the product. It’s about expectations, ease, value, and how your company communicates. Our customer survey company uses weighted scoring models to evaluate satisfaction across drivers like product performance, support interactions, and onboarding experience. Each score is analyzed by customer type, ensuring that your strategy reflects real needs—not assumptions.
For example, your new customers might appreciate speedy onboarding, while existing customers may prioritize consistent account management. By segmenting your satisfaction metrics, we uncover the nuances that most platforms miss.
The Problem with High Scores
Many companies see high scores as a reason to celebrate—but they miss the signs of early churn. That’s because high scores can mask dissatisfaction. A customer might be “satisfied” but still defect if a competitor offers more convenience, better pricing, or faster delivery.
We’ve seen organizations boast 90% satisfaction rates while simultaneously struggling with retention. Why? Because they weren’t measuring the right things—or weren’t analyzing customer responses deeply enough.
At Interaction Metrics, we bring clarity to your metrics. We show how scores connect to customer loyalty, behavior, and bottom-line results.
From Scores to Strategy
A good customer satisfaction score is nice. A strategy that improves it is better.
We transform customer satisfaction data into strategic roadmaps. Our analysts evaluate trends, decode patterns, and tie metrics to specific business outcomes. This includes mapping how pain points vary by segment, region, or product line.
Unlike standard dashboards that just show scores, this example breaks down satisfaction by drivers, time period, and team—connecting your data directly to coaching, training, and operational changes.
We go beyond the metric to understand overall customer sentiment—and how it shifts over time.
The result? A satisfaction measurement system you can trust to inform decisions across your entire company.
Customer Feedback that Drives Results
Measuring customer satisfaction requires more than just tracking numbers. It demands context. That’s why we collect open-ended comments and analyze them using a blend of qualitative methods and machine learning. This allows us to detect frustration, delight, confusion, and apathy—all signals that standard surveys miss.
When combined with quantitative metrics, customer feedback provides the texture you need to make confident improvements. Whether you’re redesigning support processes or refining product features, honest feedback can guide your next move.
One way we visualize qualitative feedback is by tagging each comment for topic and sentiment—then organizing those themes to highlight what’s most common and most urgent.
Of course, how you ask for feedback matters—poorly worded questions lead to junk data. That’s why we emphasize survey best practices to ensure every satisfaction score and comment reflects what customers truly experience.
Your Metrics Should Serve Your Customers
Ultimately, satisfaction metrics are only useful if they help you improve the customer experience. That means the data must be clear, credible, and connected to specific customer interactions. We make that possible with custom dashboards that reveal what’s improving, what’s slipping, and what needs urgent attention.
You’ll see exactly how your customer service team is performing—and how the broader experience is shaping loyalty, retention, and customer lifetime value. And you’ll get those insights faster than with any off-the-shelf survey tool.
Why Choose Interaction Metrics?
Interaction Metrics is a customer survey company for CX that delivers more than just data. We design every survey from scratch, remove bias from your questions, and apply segmentation and weighting to make your metrics accurate. With us, you don’t just measure satisfaction—you improve it.
Unlike software vendors, we already have the tools. Unlike consultants, we deliver statistically valid findings. Our clients don’t just gain insights—they gain direction.
Whether you’re trying to reduce customer churn, improve customer support, or understand what drives your loyal customers, we build the customer satisfaction measurement system that gets you there.
Customer Experience Awards
When your metrics meet statistically valid thresholds, we recognize your achievement with an official Interaction Metrics badge.
- Superior Customer Experience: Score of 85–89.9
- Outstanding Customer Experience: Score of 90+
These awards aren’t fluff—they’re backed by data. Use your badge on your website, proposals, and social channels to show customers and stakeholders that you’re committed to measurable excellence.

The Strategic Value of Satisfaction Metrics
Your satisfaction metrics shouldn’t live in a vacuum. They should inform product strategy, customer service training, pricing decisions, and more. At Interaction Metrics, we connect your customer satisfaction levels to the outcomes that matter—like customer retention, customer loyalty, and increased share of wallet.
This isn’t about dashboards. It’s about business clarity.
Ready to Make Your Metrics Work?
You’ve been collecting customer satisfaction data. But are you doing anything meaningful with it?
Let’s talk about building a better feedback system—one that provides clarity, not clutter. As a trusted customer survey company, we’ll help you use satisfaction metrics to improve every aspect of your customer experience.
Frequently Asked Questions
Customer satisfaction metrics are measurements that track how well your company meets or exceeds customer expectations. At Interaction Metrics, we go further—showing not just the scores, but the reasons behind them.
The most commonly tracked metrics include CSAT (Customer Satisfaction Score), NPS (Net Promoter Score), and CES (Customer Effort Score). But depending on your goals, you may also need metrics like customer retention rate, churn rate, or customer health score.
CSAT measures satisfaction with a specific interaction.
NPS gauges loyalty and likelihood to recommend.
CES reveals how easy it was for the customer to accomplish their goal.
Together, these provide a fuller picture of your customer experience.
We combine structured survey questions with open-ended feedback, analyze the data for bias and impact, and segment it by customer type, location, or product line. The result: satisfaction metrics that guide clear, confident decisions.
Most platforms just give you a number. We provide customer satisfaction metrics with meaning—analyzing customer responses, filtering for reliability, and mapping your scores to the actual drivers of customer experience.
High customer satisfaction often leads to loyal customers, but not always. That’s why we measure loyalty separately—looking at repeat customers, positive reviews, and net promoter scores, along with deeper satisfaction trends.
Absolutely. By identifying pain points early—before they lead to customer dissatisfaction—you can intervene and prevent churn. Our analysis pinpoints exactly where the churn risk lies.
It depends on your touchpoints, industry, and customer lifecycle. We’ll recommend a cadence based on your goals—but the key is consistency, relevance, and keeping the feedback loop actionable.
Yes. We’re a customer survey company that designs every survey from scratch. That means no biased questions, no confusing scales—just surveys that yield accurate, useful satisfaction metrics.
More Resources:

Top Customer Satisfaction Survey Companies of 2026
Last Updated: April 2, 2026 A great customer satisfaction survey company does more than send a form and count answers. It helps a business ask better questions, hear the right customers, and understand what the feedback means. The right partner helps you measure customer satisfaction in a way that is credible, useful, and tied to […]

Customer Experience Metrics: How to Measure CX In a Way That Actually Improves It
Last updated: May 4, 2026 Here is a question every CX leader should be able to answer: What did you do differently because of your last survey? If you did nothing, your measurement program is more decorative than real. What goes undiscussed in most CX conversations is that companies aren’t failing because they lack data. […]

22 Best Practices for Surveys: Tips for Writing, Design, and Analysis
You’ve probably been on the receiving end of a bad survey. Maybe it asked you to rate a delivery you never received. Or it forced you to choose between three irrelevant response options, none of which applied to you. Or perhaps you actually took the time to explain a problem in your own words, and […]

Analyzing Open Ended Survey Questions—Is AI Your Solution?
Analyzing open ended survey questions is the single most fruitful method for getting meaningful, honest feedback. Employees and customers can express themselves through text and say what’s really on their minds in a way that’s impossible through structured rating questions. Open-ends are your ‘gold’ but extracting the gold is challenging, which is why companies look […]