Last updated: May 4, 2026
Here is a question every CX leader should be able to answer: What did you do differently because of your last survey? If you did nothing, your measurement program is more decorative than real.
What goes undiscussed in most CX conversations is that companies aren’t failing because they lack data.
They’re failing because they’re measuring the wrong things. Across industries, we see that companies know their NPS (Net Promoter Score), but almost none use it to drive changes that make a difference for customers. In other words, they have scores, but not ones that lead anywhere good.
At Interaction Metrics, we build surveys, run them, and analyze the results, giving you CX metrics that lead to action. We give you end-to-end solutions with Findings Reports that uncover what matters and where to act first. Ask a Question or Book a TrueData™ Demo.
What Are Customer Experience Metrics?
Customer Experience Metrics are the measures a company uses to evaluate how customers perceive their interactions and relationships with the brand, as well as their overall experience. These include outcome metrics such as Customer Satisfaction, Net Promoter, and Customer Effort scores.
But what we see after 10+ years of doing this work is that the companies that get the most from these CX metrics aren’t just tracking scores; they’re connecting those scores to financial facts and the customer journey.
A strong measurement program helps you understand why some customers are loyal, why others are at risk, and what specific improvements will create a competitive advantage. In our experience, that means building a balanced system that combines outcomes, drivers, segments, and context, rather than relying on a single score.
Why Don’t Companies Measure Customer Experience?
Many companies rely on averages, isolated scores, and raw survey data, all of which are meaningless in themselves.
Another problem is that firms collect customer satisfaction surveys, track Net Promoter Score, and consider their job done. But high scores can hide a poor customer experience for your highest-value customers, and even a strong score can miss early signs of customer churn.
In fact, customers’ actual experiences are increasingly different from reported satisfaction levels. According to the Medallia 2026 State of Customer Experience Report, 66% of CX practitioners believe their customer experience improved over the past year, but only 17% of consumers agree.
Outcome metrics measure results, not causes. Even if customers appear satisfied overall, you can still lose high‑value accounts if frustration in a particular region, account type, or service area goes undetected. You may think you have happy customers while key accounts are quietly reducing spend, lowering customer lifetime, or preparing to switch suppliers.
That’s the problem with relying on a single aggregate metric. Serious problems get absorbed into a strong overall number.
What Are the Most Important Customer Experience Metrics?
NPS, CSAT, CES, CX Score, Total CX Score, and QCI™ (Quality of Customer Interaction) Score are important because together they measure loyalty, satisfaction, ease, the lived experience, and customer-specific priorities.
No single metric can fully measure the customer experience. What we see in effective programs is a combination of satisfaction metrics that reflect how customers feel, and experience metrics that capture what actually happened.
Below are the core CX metrics that matter most in a serious customer experience program.
| Metric | What it Measures | Best For |
|---|---|---|
| NPS | Stated Loyalty | Long-term brand health & benchmarking. |
| CSAT | Touchpoint Happiness | Measuring specific touchpoints/interactions. |
| CES | Friction & Ease | Predicting churn and identifying process blocks. |
| CX Score | Lived Experience | Measuring specific experience areas. |
| QCI™ Score | Interaction Quality | Prioritizing fixes based on customer importance. |
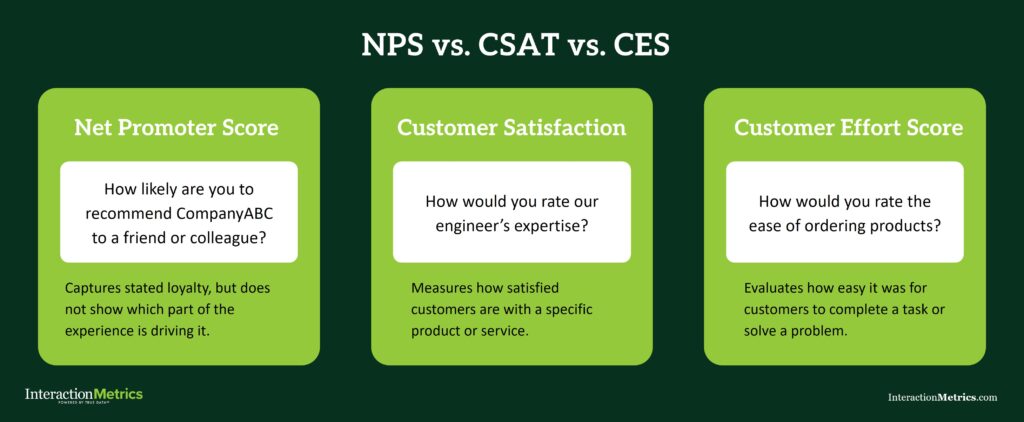
What Does Net Promoter Score (NPS) Measure?
Net Promoter Score measures customer loyalty by asking how likely they are to recommend your company. It’s one of the most widely used metrics in CX, and one of the most widely misread. It’s only useful when it is benchmarked and analyzed in context.
NPS shows whether loyalty is rising or falling, but it doesn’t explain why. Without an external benchmark, a score of 38 can mean very different things in different industries.
NPS helps track customer loyalty, identify broad shifts in sentiment, and flag where deeper analysis is needed. But it should always be paired with segmentation, driver analysis, and open-ended direct feedback.
Use Our Net Promoter Score Calculator
Use our free calculator to determine your Net Promoter Score and compare it to industry benchmarks.
Need help going beyond the score? Get in touch. We can help.
What Does Customer Satisfaction (CSAT) Measure?
Customer satisfaction measures how satisfied customers are with a specific interaction or touchpoint, such as a support call, a purchase, a repair, or troubleshooting with tech support. It’s one of the most common customer satisfaction metrics because it is easy to implement and understand.
But counterintuitively, a strong CSAT score doesn’t guarantee a healthy overall relationship, because interaction‑level ratings can miss broader concerns about pricing, communication, account support, or ease of doing business. Customers may report a good service call and still feel unsure about the relationship overall.
What we see in our clients is that CSAT becomes more useful when it’s not treated as a standalone score. Pair CSAT with open-ended customer feedback, segment analysis, and comparisons across teams, products, or regions to pinpoint where customer needs are met and where they fall short.
What Is Customer Effort Score (CES) and Why Does It Matter?
Customer Effort Score measures how easy it is for customers to complete a task, resolve an issue, or get what they need, revealing friction that other metrics miss.
It’s often undiscussed how directly ease influences loyalty. When customers struggle to resolve a problem, complete a task, or get an answer, that friction can drive customer churn even if satisfaction scores look good.
A good customer effort score program looks at the full customer journey, including website usability, ordering steps, problem resolution, communication handoffs, and response quality, to name a few. In many cases, CES is one of the best early warning signs of hidden friction that drives churn.
At Interaction Metrics we combine ease-related measures like response timeliness, site navigation, and documentation quality into a single CES to produce a clearer signal and highlight priority pain points.
What Is Customer Experience Score (CXS)?
Customer Experience Score (CXS) uses a top-minus-bottom-box calculation similar to NPS, but is used for specific elements of the survey. Whether the survey uses a 3-point, 5-point, or 10-point scale, the responses are still grouped into three basic categories: disappointed, neutral, and enthusiastic.
NPS asks a hypothetical question about whether someone would recommend the company. CXS measures what customers actually experienced in a specific area, such as technical support, delivery, responsiveness, billing, account management, or lead times. That connection to real interactions is what makes it more actionable than a broad loyalty score alone.
CXS is useful because it shows where the customer experience is strong and where it is breaking down. And because it uses wording that reflects how customers naturally describe their experience, it better captures what customers actually experienced.
What Is Total CX Score?
Total CXS is the overall customer experience score calculated across all scored elements in the survey. It’s a single number that represents the complete picture of how customers experienced your company.
Where individual CX Scores show what’s happening in a specific area, Total CXS combines these elements to show a comprehensive view. This gives leaders a summary measure of overall experience without losing access to what’s driving it.
That structure is what makes the metric so useful. Start with Total CXS to understand the overall state of the experience, then use individual CXS scores to see exactly which teams, processes, or touchpoints are driving the result.
NPS vs. CXS: What’s the Difference?
NPS and CXS both use a top-box minus bottom-box style calculation, but they ask entirely different questions.
NPS measures willingness to recommend and is a direct indicator of brand strength and long-term customer loyalty. It’s easy to benchmark and helpful for tracking high-level movement over time. But it doesn’t tell you why loyalty is moving in a particular direction.
CXS measures lived experience by asking customers to rate what they actually experienced, such as delivery, service, communication, or technical support. Instead of showing overall sentiment, it reveals which parts of the experience are strong and which are falling short.
In practical terms, NPS tells you how people feel about you overall, while CXS tells you what they actually experienced and where that experience is strong or weak.
That is why the two metrics work best together.
- NPS tells you whether loyalty is trending up or down.
- CXS shows you which parts of the experience are driving that movement.
If NPS is the signal, CXS is the explanation.
That distinction matters when something needs to change. A drop in Net Promoter Score tells you that something is wrong, while Customer Experience Score helps you see what to fix.
What Is QCI™ and Why Is It Different?
QCI™ stands for Quality of Customer Interaction, and is a metric that weights results by the specific elements of the experience that matter most to each customer in their specific situation.
Here is how it works. In the survey, customers identify what matters the most to them, which could be responsiveness, technical expertise, delivery reliability, pricing clarity, or whatever is actually relevant to their experience. We use those self-identified priorities to weight the respondent’s score to more accurately represent their experience.
What we’ve seen is that not every rating carries the same importance. If delivery matters more to one customer, it has more influence on their QCI™ score. If technical support matters more to another customer, that area carries more weight for them instead.
QCI™ reflects not just how customers rated the experience, but how important each part of that experience was to them. Standard averages treat all elements as equally important, even when customers don’t. QCI™ corrects for that by adjusting to match each customer’s priorities.
QCI™ doesn’t just show where scores are weak; it shows where weaknesses matter most. That’s what makes it one of our highest-fidelity metrics, and why we reach for it when clients want something more than a report.
Why Are Outcome Metrics Necessary but not Sufficient?
Outcome metrics are necessary because they show whether customers are satisfied or loyal, but they don’t explain what is driving those outcomes.
A customer satisfaction score, a Net Promoter Score, or even strong satisfaction metrics can tell you that customers are pleased. But they can’t tell you which team, process, or experience is shaping that result.
As Forrester noted in their Predictions 2026: Customer Experience report, the most successful CX teams are shifting their focus: “Instead of focusing solely on what customers say, they’ll prioritize understanding why customers behave as they do—and what the organization should do next.”
For example, you may post high customer satisfaction while still seeing rising customer churn among strategic accounts. That happens when averages mask account-level frustration, when important service failures affect only a small subset of the customer base, or when the survey didn’t ask the right questions in the first place.
Outcome metrics are essential. They help measure customer sentiment, track trends, and monitor reputation. But the companies that get the most value from them are the ones that pair them with deeper analysis.
Why Does Segmentation Make Customer Experience Metrics Actionable?
Segmentation reveals where problems differ by product, region, relationship type, account size, or service area.
Without it, reporting is too broad to guide decisions. Averages blend together the experiences of very different groups. But when you break results down by customer segments, product lines, account size, geography, or service model, you start to see what averages hide.
This is where a measurement system begins to support strategy. Segmentation shows which groups are easier to retain, which groups face more friction, and which groups are at risk. It also shows which parts of the business are delivering a competitive advantage and which are quietly dragging performance down.

Why Is Text Analysis Essential to CX Measurement?
Text analysis is essential to CX measurement because it explains what customers are actually experiencing. Scores tell you how they feel, and open-ended comments tell you why.
They describe friction, unmet customer expectations, unclear communication, recurring pain points, and what helped them trust the relationship. When companies ignore those comments or treat them as anecdotal, they lose the most diagnostic part of the data.
Every comment should be analyzed for theme, recurrence, and intensity. That means systematically reviewing what customers say, how often a theme appears, and how strongly customers feel about it.
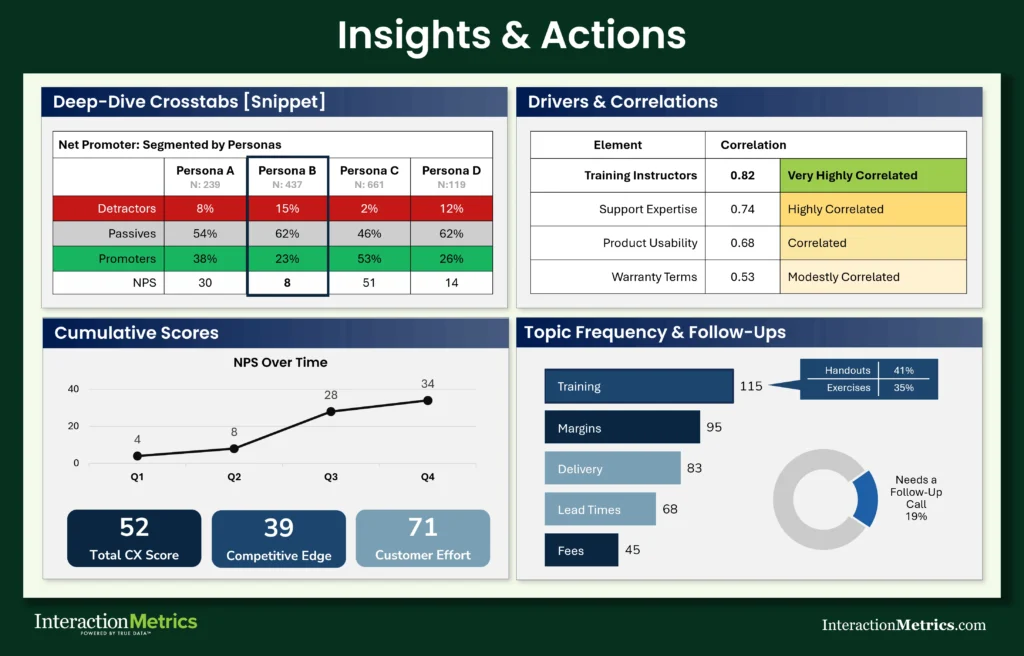
We use Topic Frequency scoring to measure the density and priority of specific themes within customer feedback.
Generic AI summaries and simple sentiment analysis tools may help organize text, but in our experience, they rarely go far enough. AI might overemphasize certain topics and over-index those themes, or get the sentiment entirely wrong.
Good analysis connects open ends to scores, to segments, and to actions. It helps identify areas that need work, identify trends early, and translate raw comments into customer experience insights.
Can High Scores Hide Serious Problems?
High scores can hide serious problems when companies measure the wrong things or fail to segment the data.
A 90% satisfaction rate may sound reassuring, but high customer satisfaction levels can coexist with specific problems that are costing you customers. Companies often mistake broad positivity for strategic clarity.
This happens when the survey is too generic, the analysis is too shallow, or the company fails to examine how different groups respond. It also happens when leaders rely on averages instead of looking at which customers feel frustrated or unsupported.
That is why serious measurement goes beyond whether your customers are happy. It looks at whether you are meeting the needs of the right customers in the right moments.
How Do Customer Experience Metrics Connect to Business Results?
Customer experience metrics show how the quality of the experience influences loyalty, retention, churn, and long-term account value. It shows whether easier service leads to stronger loyalty, whether better support drives renewals, and whether friction in one area is pushing down the customer retention rate.
This is where measurement moves from reporting into management. The best customer metrics don’t just describe the past. They help leaders set priorities and make targeted improvements.
Strong analysis also connects survey results to operational data like support tickets, average resolution time, renewal trends, and account growth.

In some programs, predictive analytics can help anticipate where customer dissatisfaction is likely to show up next. But even before that level, a strong survey system already gives leadership far more clarity than instinct alone.
What Else Should Companies Track Alongside Survey Scores?
Survey-based customer experience metrics are foundational, but they are stronger when interpreted alongside other data, such as support tickets, service response data, renewal history, complaint trends, usage patterns, and social media mentions. This information helps validate what customers are saying and catch what surveys miss.
For example, a survey may suggest strong customer engagement, while operational data shows declining usage among new customers, or satisfaction may appear stable while the customer churn rate rises in one region. Tracking both helps companies avoid false confidence in numbers that are technically accurate but strategically misleading.
This is not about drowning in data. It is about building a measurement approach that reflects real customer behavior and not just survey averages.
How Should Companies Build a Better CX Metrics Program?
Companies build a better program by combining strong survey design, meaningful segmentation, text analysis, and a combination of customer experience metrics.
- Start with the right questions. Bad survey design produces weak data no matter how advanced the reporting looks.
What we see over and over again is that companies rely on cookie-cutter questions that are biased, poorly worded, or gamed from the start. We vet surveys for 20 types of biases, giving our clients accurate data and actionable findings. - Define which customer experience metrics belong in your program based on your goals and your customer base. Use outcome measures like NPS and CSAT, but don’t stop there.
- Segment the results. Look at different products, service teams, regions, account types, and lifecycle stages. Then analyze text comments systematically to understand customer sentiment, recurring themes, and unmet customer needs.
- Prioritize improvements based on what matters most to customers and what will have the biggest effect on the relationship.
Why Do the Best Customer Experience Metrics Programs Use a Research Partner?
The best customer experience metrics programs use a research partner (like Interaction Metrics) because good measurement requires expertise in design, analysis, interpretation, and prioritization.
Survey software can field a questionnaire. It can’t reliably decide what to ask, how to reduce bias, how to measure customer satisfaction without leading respondents, how to analyze text well, or how to identify the key drivers behind loyalty and effort. Those tasks require real market research discipline.
That is where Interaction Metrics is different. We help clients measure customer experience in a way that reflects the full relationship, not just one score.
We combine benchmarking, segmentation, text analysis, and proprietary methods like QCI™ to move from raw responses to decisions.
Instead of handing clients a dashboard and asking them to interpret it themselves, we help them see what is driving outcomes and where to act first.
That is how leading companies approach CX. They don’t rely on isolated scores or instinct. They build systems that reveal what customers need, what is breaking down, and what will improve loyalty, trust, and performance.
What Is The Best Way to Measure Customer Experience?
The best way to measure customer experience is to use a system of complementary metrics that reveals not just how customers rate the experience, but why, and what to fix first.
If your current program is built around one or two top-line scores, you are making important decisions on a fraction of the evidence. That is not a measurement problem. It is a strategy problem wearing a dashboard.
Interaction Metrics builds measurement systems that go deeper. We design the surveys, deploy them, analyze the results, and turn them into the priorities your leadership team actually needs.
Let’s discuss Customer Experience Metrics; get in touch.


